- Support for XRP moving forward: $0.2924, $0.2858, $0.2811, $0.2749, $0.2669.
- Resistance for XRP moving forward: $0.2989, $0.3028, $0.3106, $0.3191, $0.3291, $0.3361, $0.3449.
Ripple Price Analysis
Ripple has seen a sharp price decline totaling 5.75% over the past 24 hours of trading, bringing the current trading price down to around $0.2935. This latest move has caused Ripple to break below $0.30 for the first time in 2019.
The cryptocurrency has seen a 8.68% price fall over the past 7 trading days, with a further 21.26% price plummet over the previous 30 trading days. Ripple is now ranked in 2nd position as it retains a $12.03 billion market cap value.
XRP/USD Price
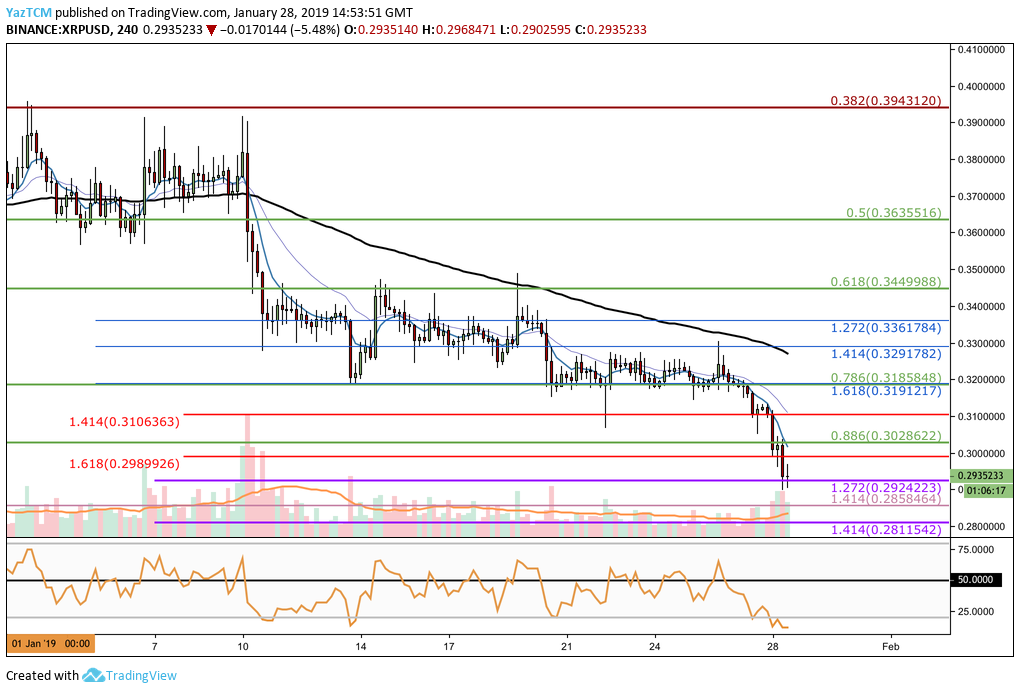
Analyzing the XRP/USD market from the 4-hour chart above, we can see that since our last Ripple analysis, the market has plummeted below our identified support level at the short-term .786 Fibonacci Retracement level (drawn in green) priced at $0.3158.
The market continued to fall aggressively below further support at the short-term .886 Fibonacci Retracement level (drawn in green) priced at $0.3028 and the short-term downside 1.618 Fibonacci Extension level (drawn in red) priced at $0.2989.
The recent price decline has recently stalled at another short-term downside 1.272 Fibonacci Extension level (drawn in purple) priced at $0.2924. Hopefully, the bulls can defend this area over the following few days if we would like to see any form of recovery.
Trend: Bearish
The recent collapse below $0.30 has rendered this market condition bearish. For this market to be considered bullish, we would need to see price action rise and break above the $0.33 handle.
Where Could XRP/USD Head Towards Next?
If the sellers continue to pressure the market lower towards the downside, we can expect immediate further support at the long-term downside 1.414 Fibonacci Extension level (drawn in peach) priced at $0.2858.
This Fibonacci Extension level was the support level that allowed the market to reverse its November/December 2018 downtrend. After hitting this level of support, price action had reversed and began to rally higher.
However, if the sellers do break below $0.2858 and go even lower, there is more support beneath at the short-term downside 1.414 Fibonacci Extension level (drawn in purple) priced at $0.2811.
What if the Bulls Regain Control?
If the bulls can regroup to hold the support at the short-term downside 1.272 Fibonacci Extension level (drawn in purple) priced at $0.2924 and begin to push price action higher, once again, we can expect immediate resistance above at the short-term .886 Fibonacci Retracement level (drawn in green) priced at $0.3028.
If the bullish pressure continues, there is higher resistance at the short-term .786 Fibonacci Retracement level (drawn in green) priced at $0.3185. This is closely followed by more resistance at the previous short-term downside 1.414 and 1.272 Fibonacci Extension levels (drawn in blue), priced at $0.3291 and $0.3361 respectively.
Even more resistance towards the upside can then be expected at the short-term .618 and .5 Fibonacci Retracement levels (drawn in green), priced at $0.3449 and $0.3635 respectively.
XRP/BTC Price
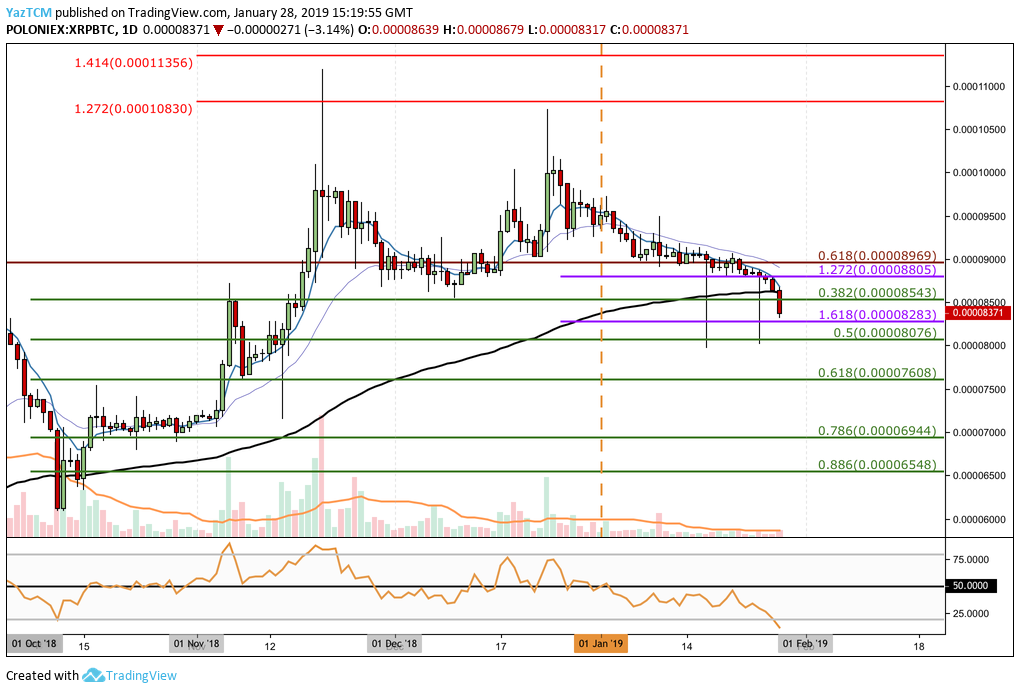
Taking a look at XRP/BTC from the daily chart above, we can see that the market has collapsed also below our previously identified support at the short-term downside 1.272 Fibonacci Extension level (drawn in purple) priced at 8,805 SATS.
The market continued to break further below additional support at the short-term .382 Fibonacci Retracement level (drawn in green) priced at 8,543 SATS. XRP/BTC is now quickly approaching further support at the short-term downside 1.618 Fibonacci Extension level (drawn in purple) priced at 8,283 SATS.
Trend: Bearish
The trend is undoubtedly bearish in the short term, at this moment in time. For this market to be considered as bullish in the short term, we would need to see price action break above the 9,000 SATS handle.
Where Could XRP/BTC Head Towards?
If the selling pressure continues, we can expect price action to hit the downside 1.618 Fibonacci Extension level (drawn in purple) priced at 8,283 SATS in no time.
If the bears drive price action below this handle, further support below can be found at the short-term .5 Fibonacci Retracement level (drawn in green) priced at 8,076 SATS. This is followed by support at the short-term .618 Fibonacci Retracement level (drawn in green) priced at 7,608 SATS.
If the sellers continue to push XRP/BTC below the 7,000 SATS handle, we can then expect more support towards the downside at the short-term .786 and .886 Fibonacci Retracement levels (drawn in green), priced at 6,944 SATS and 6,548 SATS respectively.
What if the Bulls Hold at 8,283 SATS?
When price action reaches 8,283 SATS, if the bulls can defend this area and begin to push price action higher, immediate resistance above can be located at the short-term .382 Fibonacci Retracement level (drawn in green) priced at 8,543 SATS.
Resistance above this can be expected at the long-term bearish .618 Fibonacci Retracement level (drawn in red) priced at 8,969 SATS.
Conclusion
The recent break below the $0.30 handle will be a big hit to the sentiment within the XRP market as speculators will suspect more incoming damage to follow. However, if the bulls can hold at the $0.2924 handle and begin to push price action higher, this may be a short-lived market drop.