
QASH has seen a relatively muted price drop over the past 24 hours of trading, totaling 1.10%, as the rest of the cryptocurrency market plummets. QASH is currently trading on exchanges at a price of $0.2168, after seeing a 2.44% price hike over the past 7 trading days.
QASH is the native currency that is used on the Liquid+ platform to pay for prime brokerage services and trading fees. The Liquid+ platform was founded by Mike Kayamori and Mario Gamez Lozada as they intended to come up with a solution for the liquidity problem seen within the cryptocurrency market.
While each individual cryptocurrency exchange has their own level of liquidity, there is no solution to borrow liquidity from each other when the market has a demand for it. The Liquid+ platform is designed to fix the liquidity problem as the platform aggregates all exchanges in the world to one single trading platform.
In this way, all the individual exchanges can borrow liquidity from one another, when needed, through the Liquid+ platform.
QASH is currently an Ethereum-based ERC-20 token but they have plans to migrate to their own blockchain in 2019. This will allow financial institutions to build dapps on top a new blockchain that is natively Know Your Customer (KYC) and Anti Money Laundering (AML)-compliant.
For a more in-depth overview of QASH ,we recommend you read our “What is QASH” guide.
QASH is currently ranked 77th in terms of overall market cap across the entire industry. It has a total market cap value of $75 million after the 9-month old coin suffered a 56% price drop over the last 90 trading days.
Let us continue to analyze price action for QASH over the long term.
QASH Price Analysis
QASH/USD – LONG TERM – DAILY CHART
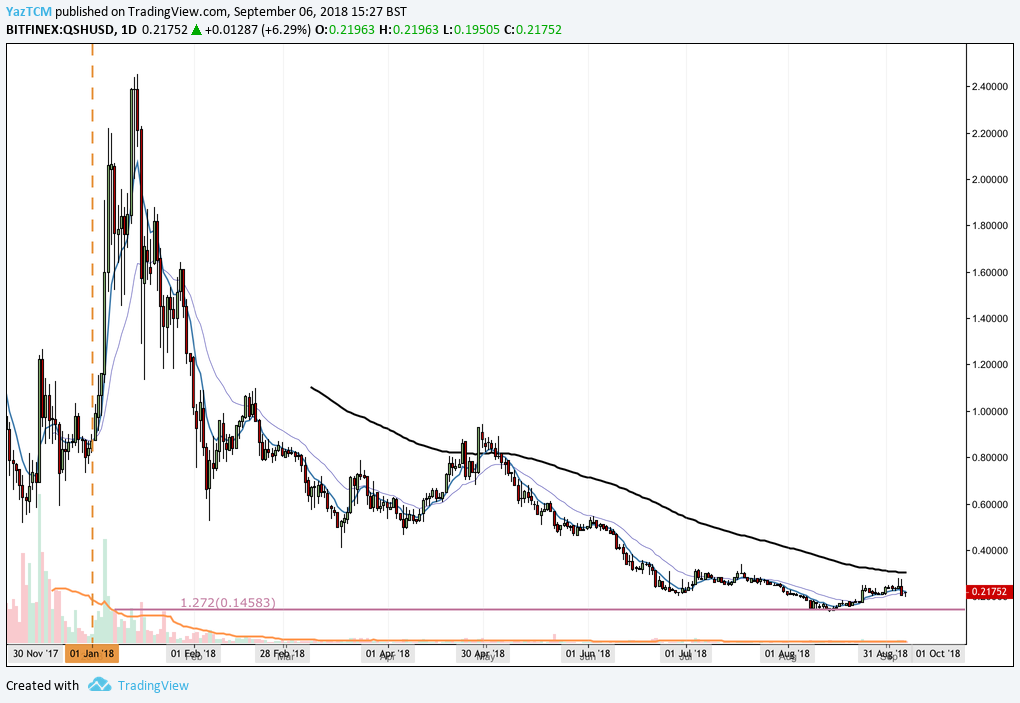
Analyzing price action over the long-term perspective above, we can see that price action had experienced a bullish run towards the end of the year of 2017. The market started at a low of $0.51 on December 11, 2017 and extended to an all-time high of $2.45 on January 15, 2018. This was a price increase of over 360% from low to high.
We can see that price action rolled over aggressively after placing the all-time high. The market has continued to fall throughout the year of 2018, and has only recently found a small form of support highlighted by a downside 1.272 Fibonacci Extension level priced at $0.14. We can see that as price action approached this level in August 2018, the market rebounded and proceeded to rally slightly higher.
QASH is now currently down around 90% from its all-time high. It currently trades around $0.21.
Let us continue to analyze price action a little closer over the shorter period so we can highlight any potential support and resistance areas.
QASH/USD – SHORT TERM – DAILY CHART
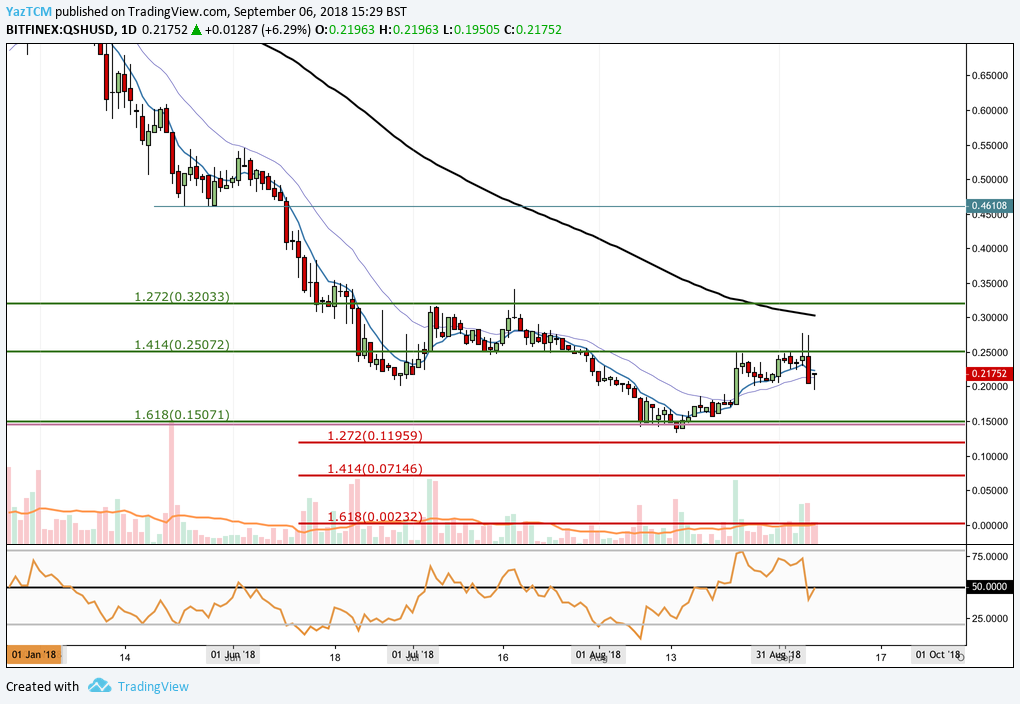
Analyzing price action with the benefit of a shorter time frame above, we can see that the recent support witnessed at the $0.14 handle in August 2018 was significantly bolstered by a further shorter-term downside 1.618 Fibonacci Extension level (drawn in green) priced at $0.15.
The market has rebounded from this level, and rallied until it had met resistance located at the downside 1.414 Fibonacci Extension level (drawn in green) priced at $0.25. We can see that as the market approached this level, price action hit resistance and continued to roll over and fall.
Analyzing the chart over the past month, it is apparent that the market has been trapped within a range bound between $0.25 as the upper boundary and $0.15 as the lower boundary.
If the bulls can continue to push price action above the resistance located at the upper boundary of the range priced at $0.25, then we expect initial resistance to be located at the 100-day moving average level which is currently hovering around the $0.30 handle.
The market will require significant momentum to overcome this area due to the combination of resistance provided from the psychological $0.30 round number handle and the 100-day moving average.
If the market can continue further above this level, then higher resistance can be located at the downside 1.272 Fibonacci Extension level (drawn in green) priced at $0.32, followed by resistance found at the $0.46 handle.
Alternatively, any negative pressure is expected to be absorbed by the lower boundary of the trading range priced at $0.15. If the bears do indeed manage to push price action further below, we expect immediate support to be located at a short-term downside 1.272 Fibonacci Extension level (drawn in red) priced at $0.11, followed by the psychological round number handle of $0.10.
The technical indicators within the market are generally showing neutral readings. The RSI has broken below the 50 handle but the bulls are battling to try and bring the RSI back above. If the RSI can break above 50, we can expect the bullish momentum within the market to increase.
Let us continue to quickly analyze price action for QASH relative to Bitcoin over the long term.
QASH/BTC – LONG TERM – DAILY CHART
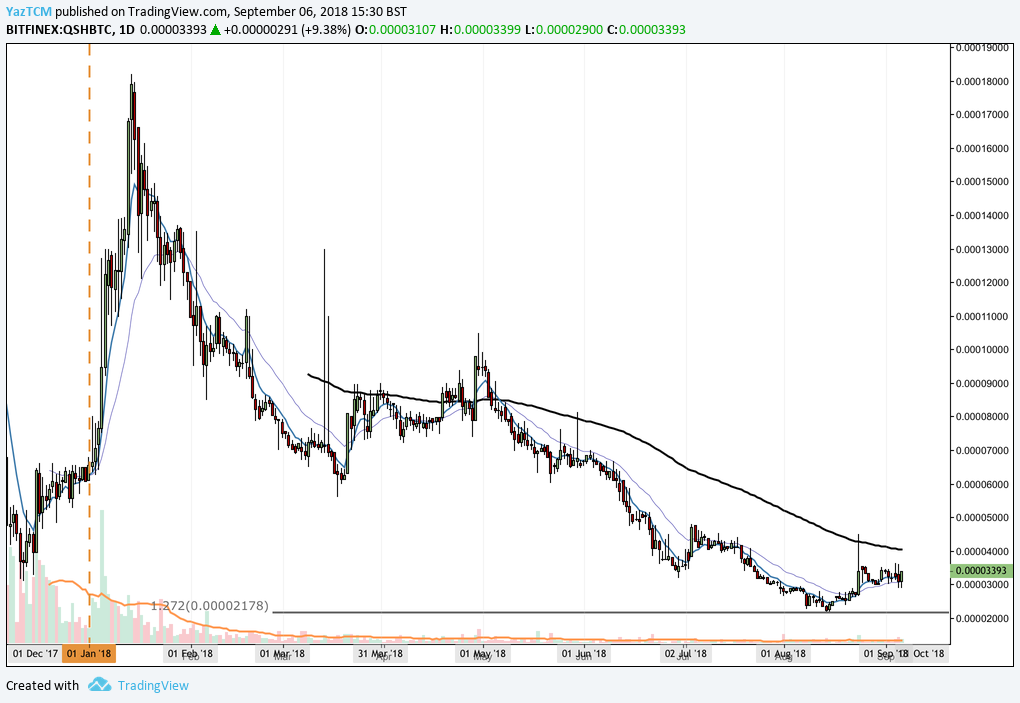
Analyzing price action relative to Bitcoin over the long term, we can see that the market had experienced a bullish run toward the end of 2017 as price action stated from a low of 3,101 SATS on December 12, 2017 and extended to an all-time high of 18,200 SATS on January 14, 2018. This was a price increase totaling 490% from low to high.
We can see that after placing the ATH price action went on to decline substantially. It has recently rebounded at support located at a downside 1.272 Fibonacci Extension level priced at 2,178 SATS. The market is currently trading around the 3,393 SATS handle (at the time of writing).
Let us continue to analyze price action a little closer over the short term to highlight any potential support and resistance areas.
QASH/BTC – SHORT TERM – DAILY CHART
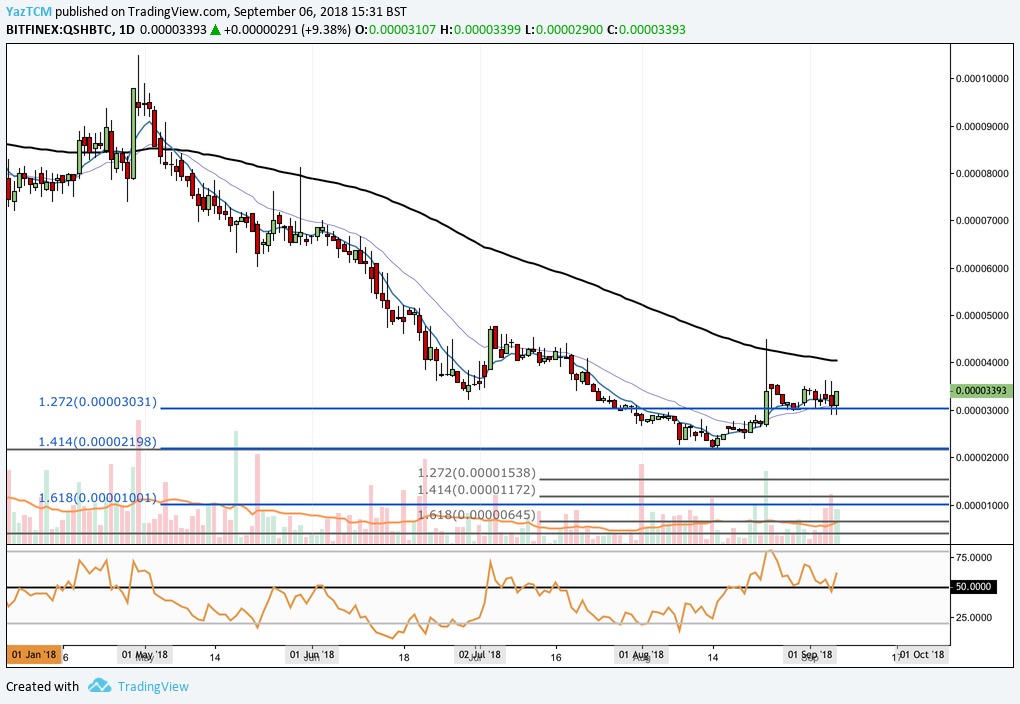
Analyzing price action over the shorter term, we can see that the recent support at 2,178 SATS was bolstered further by a shorter-term downside 1.414 Fibonacci Extension level (drawn in blue) priced in the same area.
Price action has since rebounded from this support, and broken above the downside 1.272 Fibonacci Extension level (drawn in blue) priced at 3031 SATS. The market is now using this price area as support going forward.
If the bullish pressure can continue, we can expect immediate resistance to be located at the 100-day moving average which is currently priced at the 4,000 SATS handle. We can see that the market has attempted to break above this moving average during August 2018 but was aggressively rejected. Price action will require significant volume to break up above this level.
If the bulls can push the market above the 100-day moving average, further resistance can be expected at the highs seen in July 2018 priced around 5,000 SATS.
Alternatively, if the bears can push price action back below support located at 3,031 SATS, we expect immediate support to be located at the previous downside 1.414 Fibonacci Extension level (drawn in blue) priced at 2,198 SATS. Further support expected below this level can then be expected at 2,000 SATS, followed by 1,538 SATS.
The technical indicators within the market are largely favoring the bulls at this moment in time. The RSI is trading above the 50 handle, indicating that the bulls are still in control. If the RSI can stay above 50, we can expect this market to continue to regain some of the losses incurred over the past trading year.
Related: Zcoin Price Analysis: XZC Drops as Bitcoin Drags Down the Entire Market, Strong Support in Sight