
It seems like we may be on the fringe of a fresh new bull market for Ethereum as confirmed by prominent cryptocurrency analyst Etherdamus, formerly known as the ScienceGuy9489. According to Etherdamus, the technical signal known as the “Golden Cross” has occurred on the ETH/USD chart;
#ETH Golden Cross Confirmed. Could take up to a few days for effect to show in price. pic.twitter.com/eK3dksfAn7
— Formerly ScienceGuy9489 (@Etherdamus) May 21, 2019
The Golden Cross is an indicator which suggests that a long-term bull market will occur moving forward. It occurs when the short-term moving average, in this case the 50-day EMA, crosses up above the longer-termed moving average, the 200-day EMA, to form a moving average crossover signal.
Etheredamus has also noted that it could take a few days for this to take effect. Typically, it could even take a few weeks for the effect to be seen in price action. The Golden Cross signals that there is a huge change in trend coming up, and that the nearest levels of support should be treated as significant support. One of the major requirements for a Golden Cross is for the market to have previously been in an extended downtrend that is starting to end, which is where Ethereum has been over the past 3 months.
Ethereum is currently trading at a price of around $252, after seeing a price hike totaling 8.40% over the past week, beating Bitcoin’s gains over the same period. Ethereum has also seen a remarkable price increase of 43% over the past 30 trading days, which extends to a further 73% over the past 90 trading days.
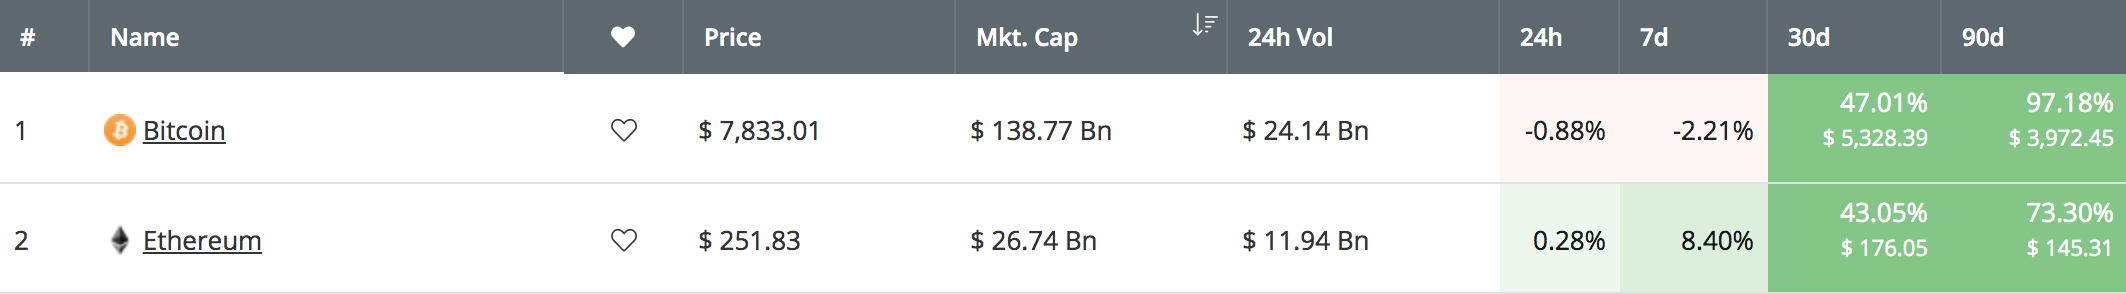
Image Source: https://coincheckup.com
In this article, we will take a look at the ETH/USD market and highlight some potential areas of resistance on the way higher toward $300 and beyond if the Golden Cross results in a bullish press higher.
Let us continue to take a look at the ETH/USD market and highlight some potential areas of support and resistance moving forward.
Ethereum Price Analysis
ETH/USD – MEDIUM TERM – DAILY CHART
What Has Been Going On?
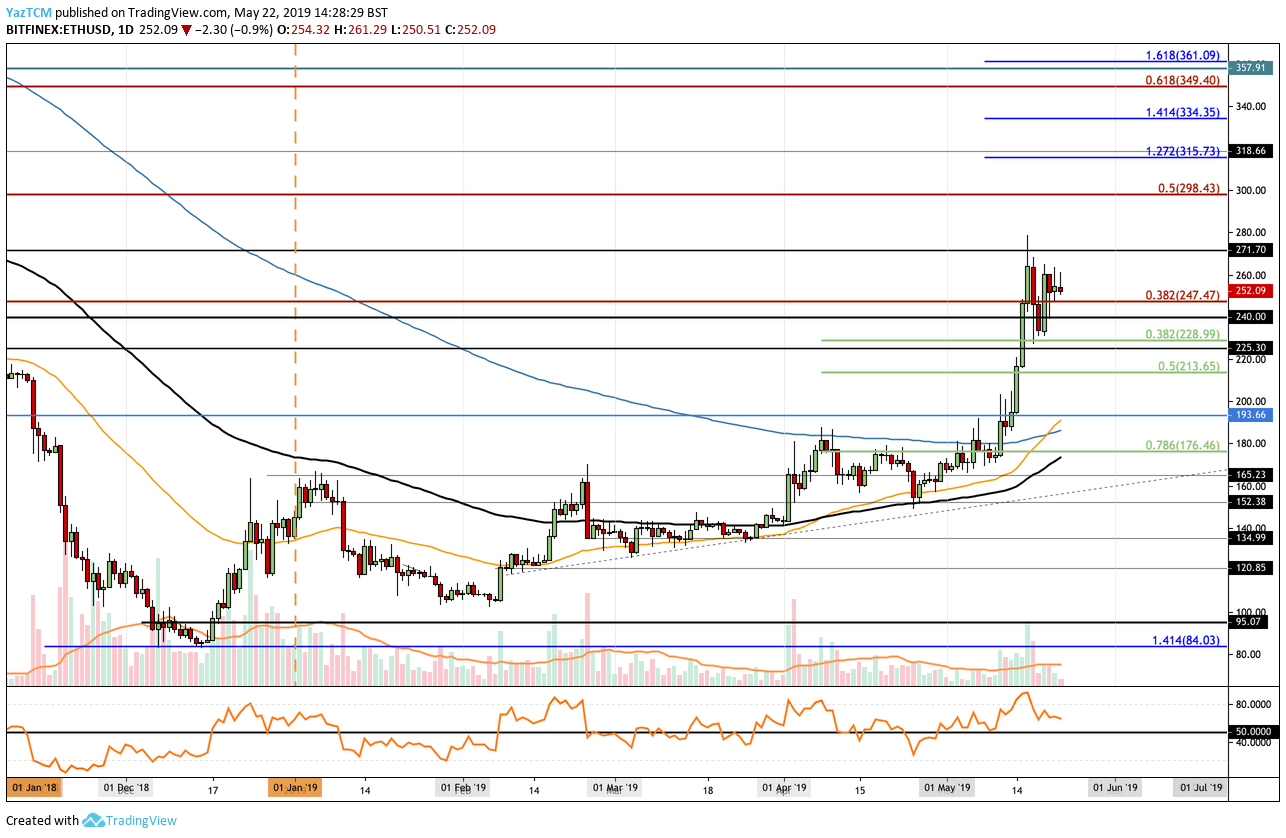
Analyzing the ETH/USD chart above, we can see that since reaching resistance around the $270 level, Ethereum has been trapped within a period of consolidation. Price action has been trading sideways between the $270-$228 price range.
We can also clearly see the Golden Cross occurring on May 20, 2019, and being confirmed on May 21, 2019 when the 50-day EMA (orange line) crossed up above the 200-day EMA (blue line).
What Is the Current Trend?
After a 43% price increase over the past 30 trading days, the current trend for the market is most certainly bullish over the medium term. For this bullish trend to be invalidated, we would need to see price action fall and break beneath the $200 level.
Where Is the Resistance Above the Market?
Moving forward, if the bullish pressure can cause ETH/USD to break above the $270 level, we can expect immediate higher resistance above to be located at the $280 level. Above $280, higher significant resistance can then be found at the long-term bearish .382 Fibonacci Retracement level (drawn in red), priced at $298. This bearish Fibonacci Retracement level is measured from the July 2018 high to the December 2018 low. If ETH/USD breaks above here, they will be free to make an attempt at our first target of $300.
If the bulls can continue above $300, further resistance can then be expected at the short-term 1.272 and 1.414 Fibonacci Extension levels (drawn in blue), priced at $315 and $334 respectively. This is then followed up with resistance at the bearish .618 FIbonacci Retracement level (drawn in red), priced at $349.
What If the Sellers Regroup?
Alternatively, if the sellers regroup and begin to push the market lower in the short term, we can expect immediate support beneath the market to be located at $247 and $240. Beneath this, further support can then be expected at the short-term .382 and .5 Fibonacci Retracement levels (drawn in green), priced at $228 and $213. This is then followed up with more strong support at the $200 level.
If the sellers continue further beneath $200, support below can be located at $193, $176, and $165.
What Are the Technical Indicators Showing?
The RSI has recently slipped from overbought conditions, which indicate that the bulls have taken a recent break. This is represented by the recent period of consolidation that we have seen. However, the RSI still remains above 50, which indicates that the bulls are still in control of the market. If it can remain above 50 moving forward, we can expect the bullish signal from the Golden Cross to unfold.
Conclusion
The Golden Cross is usually a very potent bullish signal to indicate that the market has entered a new bullish phase. However, this does not mean that it is a great time to buy straight away. It is important to monitor the market and look for strong support levels as entry prices. The Golden Cross takes time to mature and does not always result in an instantaneous price surge.