
ZenCash has experienced a price drop akin to the entire market, falling a total of 10% over the past 24 hours, at the time of writing. The privacy-focused cryptocurrency is currently exchanging hands at $17.61, and has suffered a further 24.48% price drop over the past trading week.
ZenCash was launched on May 23, 2017 by Rob Viglione and William Wolf. It aims to become a cryptocurrency that prioritizes privacy to facilitate private economic activity and communications. It integrates a money payment system, a media content distribution platform, a messaging system, and a decentralized autonomous organisation (DAO) system within its network.
The technology behind ZenCash was forked from its predecessor, ZClassic and uses ZK-SNARKS (Zero Knowledge Succinct Non-interactive ARguments of Knowledge) to achieve the anonymity required. This allows users in the network to have a choice on the level of privacy when sending transactions. The transactions are shielded and can either be completely private, hiding the transaction amount and sender/receiver details, or pseudo-anonymity which hides the transaction amount but not sender/receiver details.
Some of the products and services that ZenCash offers are;
- ZenChat – Encrypted text-based messaging through blockchain
- ZenPub – A content distribution network that allows users to anonymously post documents to IPFS.
- ZenHide – Domain fronting to hide endpoints whilst web browsing.
The ZenCash network is currently undergoing a rebranding, expected to be completed within the next 2 weeks, which will see a whole new name and identity for the ZenCash project. This identity change is designed to allow the project to reach a wider audience.
ZenCash is currently ranked 71st in terms of overall market cap across the entire industry, with a total market cap value of $80.39 million. The cryptocurrency is 73% down from its all-time high, and has significant losses to recover as the coin has dropped 40% over the past 90 trading days.
Let us continue to analyze price action for ZenCash over the long term.
Price Analysis
ZEN/USD – LONG TERM – DAILY CHART
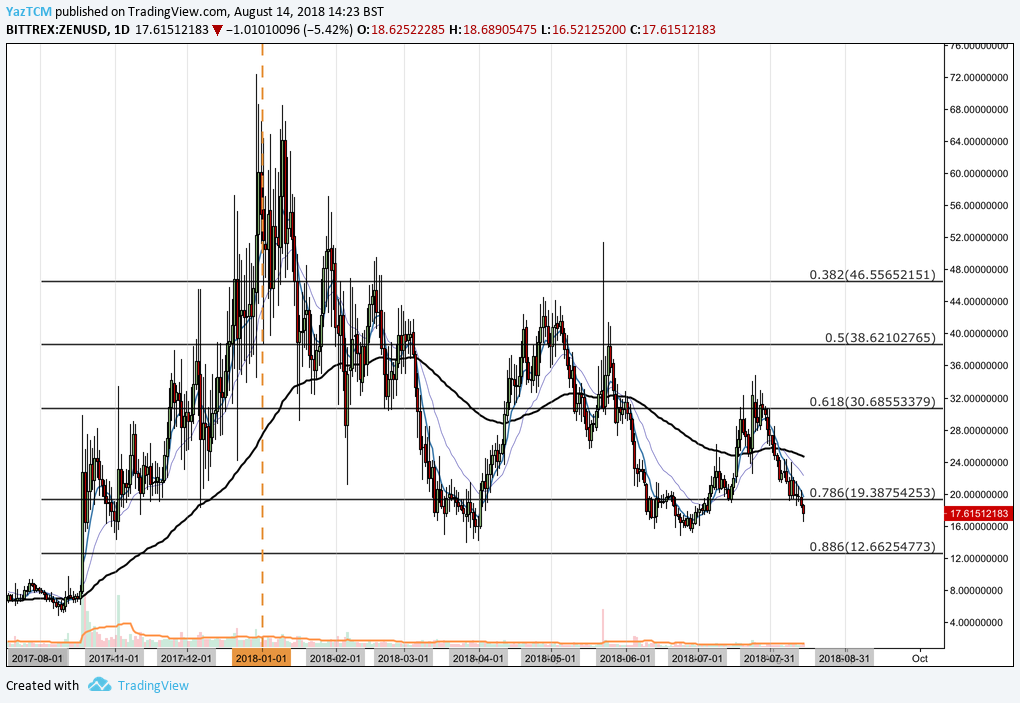
Analyzing the market from the long-term perspective above, we can see that price action had experienced a significant bullish price run during the last 3 months of 2017. Price action started from a low of $4.77 on October 9, 2017 and extended to an all-time high of $72.31 on December 30, 2017. This was a price increase totaling over 1,325% from low to high.
After placing the all-time high, we can see price action began to rapidly decline, originally finding support at the .618 Fibonacci Retracement priced at $30.68 during January 2018. This Fibonacci Retracement is measured from the entire bullish run previously aforementioned.
Price action held this .618 Fibonacci Retracement support level during February but proceeded to fall below this level as March began trading. Price action continued to decline until finding support around $16 below the .786 Fibonacci Retracement (priced at $19).
Let us continue to analyze price action a little closer over the more recent period to highlight any potential support and resistance zones.
ZEN/USD – SHORT TERM – DAILY CHART
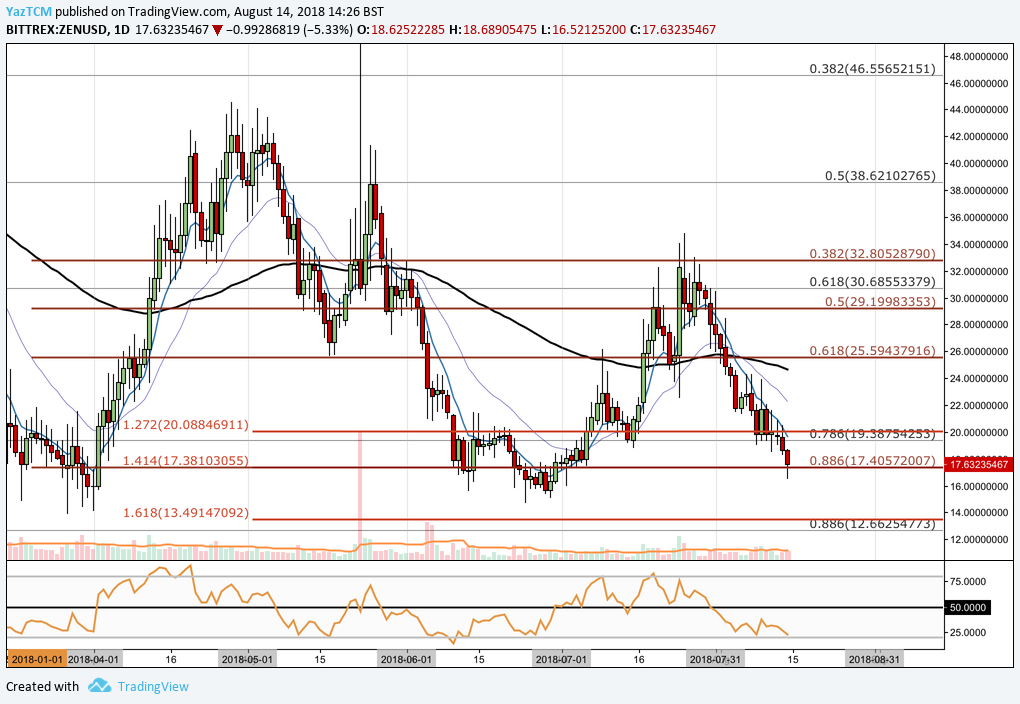
Analyzing the market from the benefit of a shorter time horizon, we can see that there was another bullish price run when price action started from a low of $13.88 on March 27, 2018 and extended to a high of $44.55 on April 28, 2018. This was a price increase totaling 232% from low to high.
As May started to trade, we can see price action had found support at the short-term .618 Fibonacci Retracement priced at $25.59. This is a Fibonacci Retracement measured from the entire bullish run experienced during April, outlined above. Price action continued to fall further lower during June until support was found around the short-term .886 Fibonacci Retracement priced at $17.40. The market had specifically found support marked by the low-day-close price seen during April.
July turned out to be a promising month for the coin as price action rose back to $32. However, towards the end of the month, price action had found resistance located at the short-term .382 Fibonacci Retracement priced at $32.80, and proceeded to tumble once again. We can see that price action has continued to fall to where it is currently trading, at support marked by the short-term .886 Fibonacci Retracement level priced at $17.40.
If the bulls can regain control and keep price action above the support found at the .886 Fibonacci Retracement level, we expect immediate resistance to be located at the psychological round number level of $20. This area of resistance is also bolstered by a downside 1.272 Fibonacci Extension level priced in the same area, which has provided some resistance previously during June 2018.
Further resistance above this level can be expected at the short-term .618 Fibonacci Retracement level priced at $25.59. This area also contains the 100-day moving average which will add to the level of expected resistance in this area.
Alternatively, if the predominant bearish market persists and pushes price action below $17.40, we expect immediate support to be located around $16-$15 which is the price low seen throughout June 2018. Further support located below this level is expected at the downside 1.618 Fibonacci Extension level priced at $13.49, followed by the long-term .886 Fibonacci Retracement level priced at $12.66.
The technical indicators within the market are currently heavily favoring the bears at this current moment in time. The RSI is trading close to extreme oversold conditions just slightly above the 25 handle. For a sign that the bearish momentum is beginning to fade, we will be looking for the RSI to slowly make its way back toward the 50 handle. A break above 50 would indicate that the bulls are starting to regain control within the market.
Similarly, the moving averages are all pointing in an extremely bearish territory as the 7-day EMA (blue moving average) is far below the 21-day EMA (purple moving average). If we are to expect any form of bullish momentum, we will be looking for the 7-day EMA to turn upwards and approach the 21-day EMA for a bullish crossover signal.
Related: Top 8 Privacy Coins