- Zcash has rebounded from support provided at $61.66 over the past 2 trading sessions.
- Price action is now trading at resistance at the $81.07 handle.
- Support moving forward: $75, $70, $65, $61.66, $55, $50, $45, $42.55.
- Resistance moving forward: $81.07, $88.02, $92.33, $100, $101.43, $110.53, $123.49, $131.20.
Zcash has seen a price hike totaling 15% over the past 24 hours of trading, one of the top performers in the top 20 coins over the stated period. The cryptocurrency is exchanging hands at a price around $77, at the time of writing, after undergoing a 7-day price decline totaling 11.11%.
ZCash is ranked in 19th position in the market cap leaderboard, with a $405 million valuation. The privacy-focused cryptocurrency has seen a very turbulent 90-day trading period, losing a precipitous 49% in value. The 25-month old project trades at a value that is 91% lower than the all-time high price.
Let us continue to analyze ZEC/USD over the long term to gather a fresh update on the long-term perspective.
Zcash Price Analysis
ZEC/USD – LONG TERM – DAILY CHART
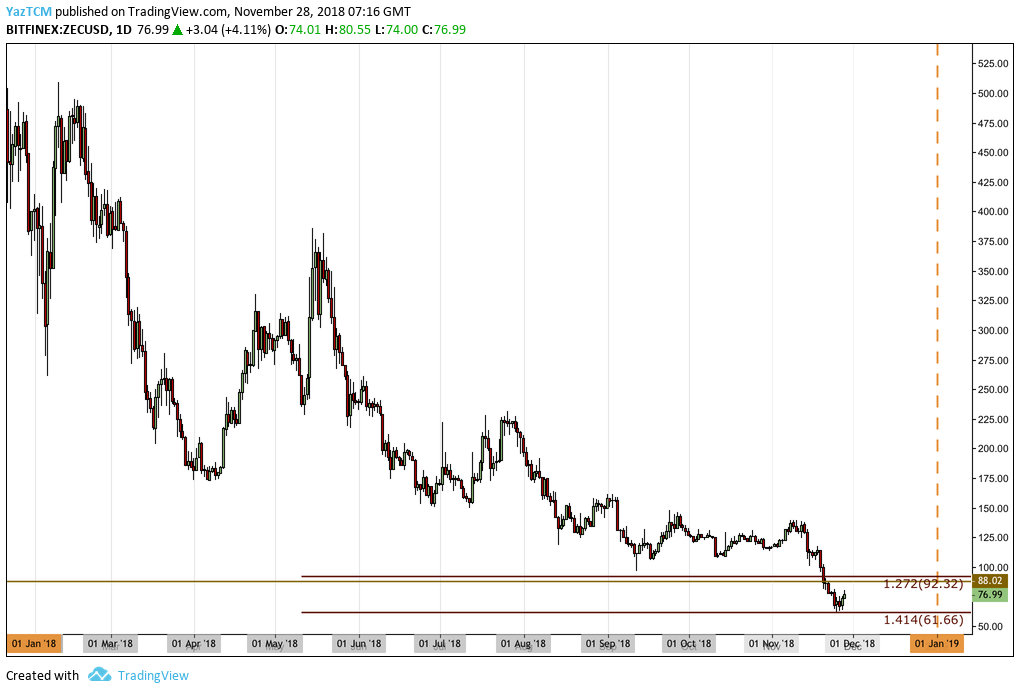
Looking at ZEC/USD from the long-term chart above, we can see that the market has been consistently declining since the start of the year, falling from a high above $500 to a low well below $100.
As shown on the chart, we can see that in November 2018 this trend continued. The market dropped below $100 and continued to fall further toward the $60 handle.
We had expected the $88.02 level to provide significant support as it was the May 2017 price low. However, during the market capitulation, price action plummeted below this level and continued to drop until more support was reached below at a medium-term downside 1.414 Fibonacci Extension level priced at $61.66.
As ZEC/USD reached this area of support, the market rebounded slightly in an attempt to recover some of the losses.
Let us continue to analyze price action a little closer over the short term and highlight any areas of potential support and resistance moving forward.
ZEC/USD – SHORT TERM – DAILY CHART
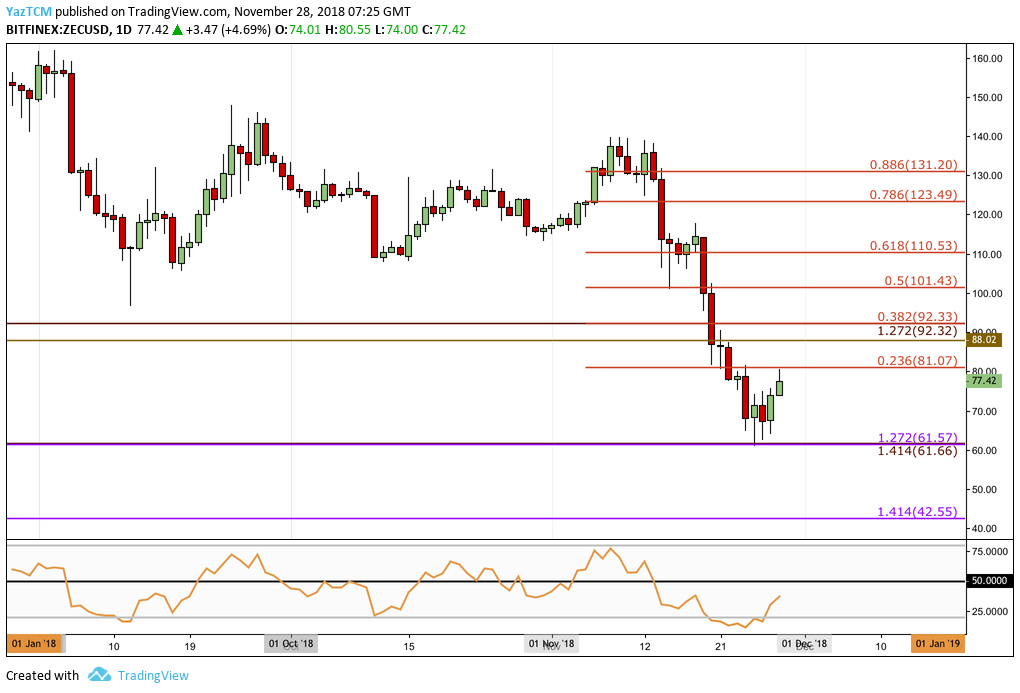
Evaluating ZEC/USD from a closer time horizon, we can see that the support at the previously highlighted downside 1.414 Fibonacci Extension level was further bolstered by another short-term downside 1.272 Fibonacci Extension level (drawn in purple) priced in the same region.
As ZEC/USD reached this area, the market halted its downtrend and initiated a small rebound. We can see that the market has now found some short-term resistance provided by a bearish .236 Fibonacci Extension level priced at $81.07.
Moving forward, if the buyers can continue to climb up above the resistance at $81.07, they will immediately meet resistance at the May 2017 low priced at $88.02. This is followed by further resistance provided by the previous downside 1.272 Fibonacci Extension level (drawn in red) priced at $92.32.
If the bulls can continue with their ascension and break back above the $100 handle, we can expect more resistance higher to be located at the bearish .5 and .618 Fibonacci Retracement levels, priced at $101.43 and $110.53 respectively.
Further resistance above this can be located at the .886 Fibonacci Retracement level priced at $131.20, followed by the November 2018 high priced around $140.
On the other side of the equation, if the bulls fail to break above $81.07 and resume their bearish trend instead, we can expect immediate support below to be located at the combined support provided at the downside 1.272 Fibonacci Extension level (drawn in purple) priced at $61.57.
If the sellers continue to drive price action further below $60, more support beneath is located at the psychological round number level at $50, followed by more support provided by the downside 1.414 Fibonacci Extension level (drawn in purple) priced at $42.55.
The RSI indicator has recently turned up away from oversold conditions as it makes its way back toward the 50 handle. A break above the 50 handle would indicate that the buyers have finally taken charge of the momentum within the market, in which case we would expect to see ZEC/USD continue to climb back toward the $100 handle.
Let us continue to quickly analyze ZEC against BTC over the short term and highlight any potential areas of support and resistance.
ZEC/BTC – SHORT TERM – DAILY CHART
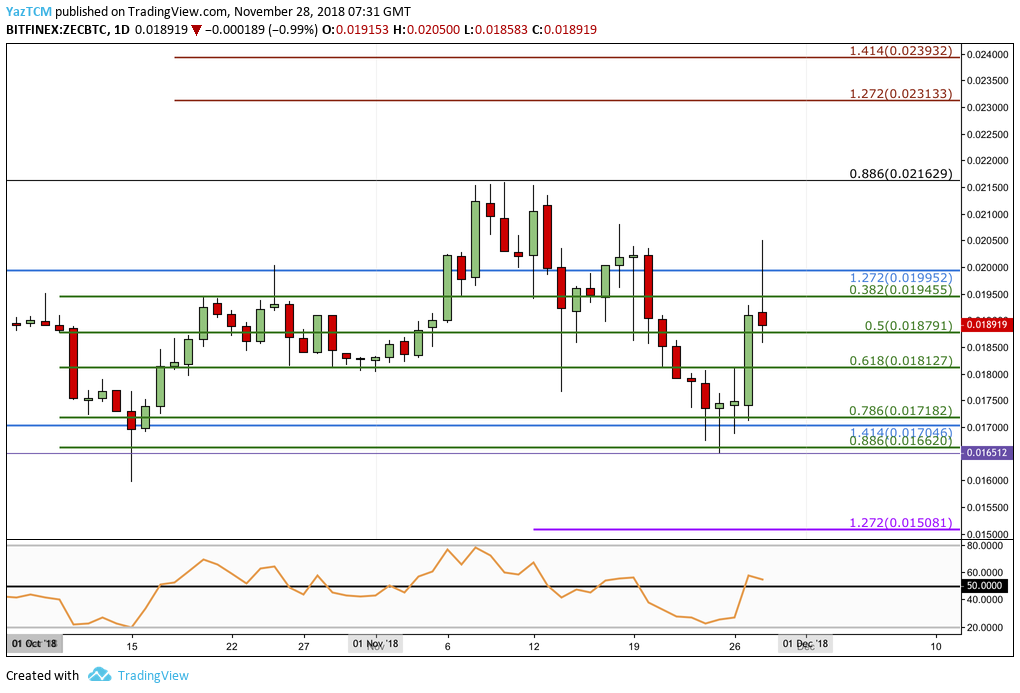
Analyzing ZEC/BTC over the past few weeks, we can see that the market had started November 2018 in a promising way as ZEC/BTC began to rise to meet resistance provided by the long-term .886 Fibonacci Retracement level (drawn in black) priced at 0.021629 SATS.
However, the bulls were not able to break above this resistance level, causing the market to roll over.
During the mid-November 2018 cryptocurrency bloodbath, ZEC/BTC began to plummet into support provided by the short-term .886 Fibonacci Retracement level (drawn in green) priced at 0.016620 SATS. More specifically, the market had found stronger support at the .786 Fibonacci Retracement level (drawn in green) priced at 0.017182 SATS.
ZEC/BTC had recently rebounded from this level of support, traveling as high as 0.02 SATS. We can see that the market is now resting near support provided by the short-term .5 Fibonacci Retracement level (drawn in green) priced at 0.018791 SATS.
Looking ahead, if the sellers push ZEC/BTC below the 0.018791 SATS handle, we can expect immediate significant support beneath to be located at the short-term .618 and .786 Fibonacci Retracement levels, priced at 0.018127 SATS and 0.017182 SATS respectively.
If the bearish momentum continues to drive price action even lower, more support below can be located at the short-term .886 Fibonacci Retracement level priced at 0.016620 SATS, followed by the October 2018 low priced at 0.015977 SATS.
Alternatively, if the bullish momentum can push ZEC/BTC higher above resistance at the 0.02 SATS handle, we can expect resistance above to be located at the long-term .886 Fibonacci Retracement level (drawn in black) priced at 0.021629, followed by the short-term 1.272 Fibonacci Extension level (drawn in red) priced at 0.023133.