- Ripple remains relatively stable since the surge created from the PNC partnership announcement.
- XRP/USD currently is trading below the $0.50 handle as bulls and bears battle to gain dominance.
- RSI is producing a very neutral reading.
- Support levels: $0.4659, $0.4242, $0.4022, $0.3775, $0.3596, $0.2669, $0.2468.
- Resistance levels: $0.5280, $0.5901, $0.60, $0.6852, $0.7548, $0.80.
Over the past 24 hours of trading XRP/USD has seen a 4% price increase in value. It is currently exchanging hands at a price around $0.47 after seeing a small 1.3% price decline over the past 7 trading days.
Ripple had experienced a significant surge in September 2018 upon the announcement of a partnership with a top 10 US bank called PNC.
The cryptocurrency is currently ranked 3rd across the industry as it holds a $18.40 billion total market cap value. The 63-month old cryptocurrency is currently showing stronger signs of stability relative to its competition over the past 90 trading days.
XRP only had a slight 0.26% price decline. Compared to Ethereum’s 56% 90-day drop and Bitcoin’s 20% 90-day drop, Ripple seems to be holding up relatively well.
Let us continue to analyze price action for XRP/USD over the long term to get an overview of the market over the course of the trading year.
Ripple Price Analysis
XRP/USD – LONG TERM – DAILY CHART
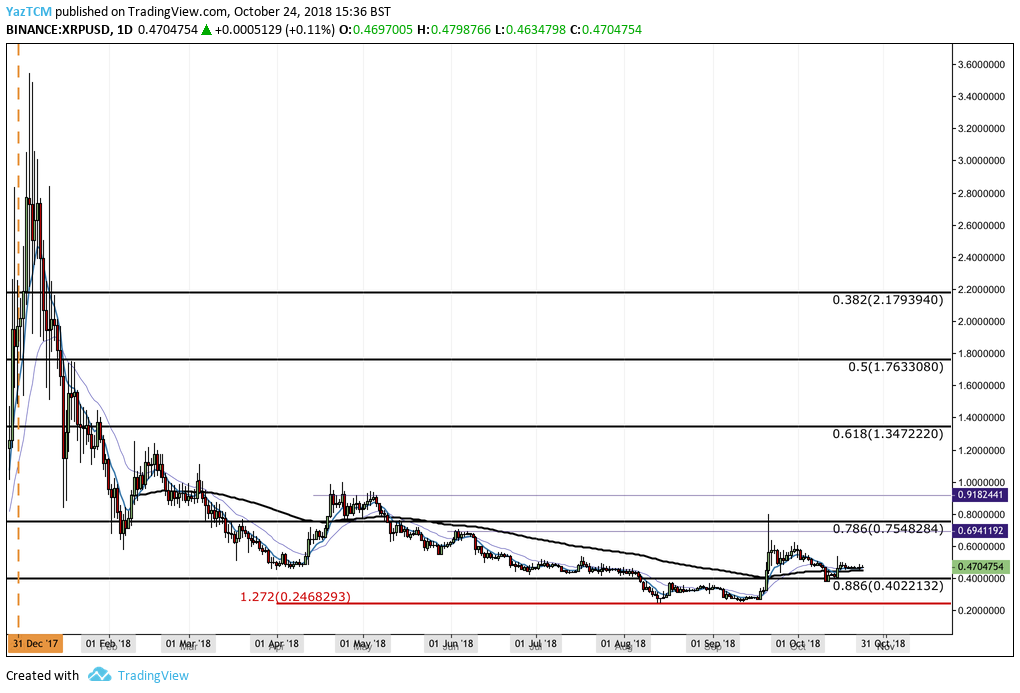
Analyzing price action from the long-term perspective above, it is evident that the trading year has not been easy for Ripple. Since placing the all-time high price of $3.54 on January 4, 2018, the market has consistently depreciated.
Price action for XRP/USD had recently found some strong support during August 2018 when the market approached a bearish 1.272 Fibonacci Extension level priced at $0.2468. As XRP/USD reached this level of support, the market reversed and rebounded.
This price level continued to support the market during September 2018 before XRP/USD had experienced its surge in mid-September.
Let us continue to analyze the XRP/USD market from a closer perspective and highlight any potential support and resistance areas moving forward.
XRP/USD – SHORT TERM – DAILY CHART
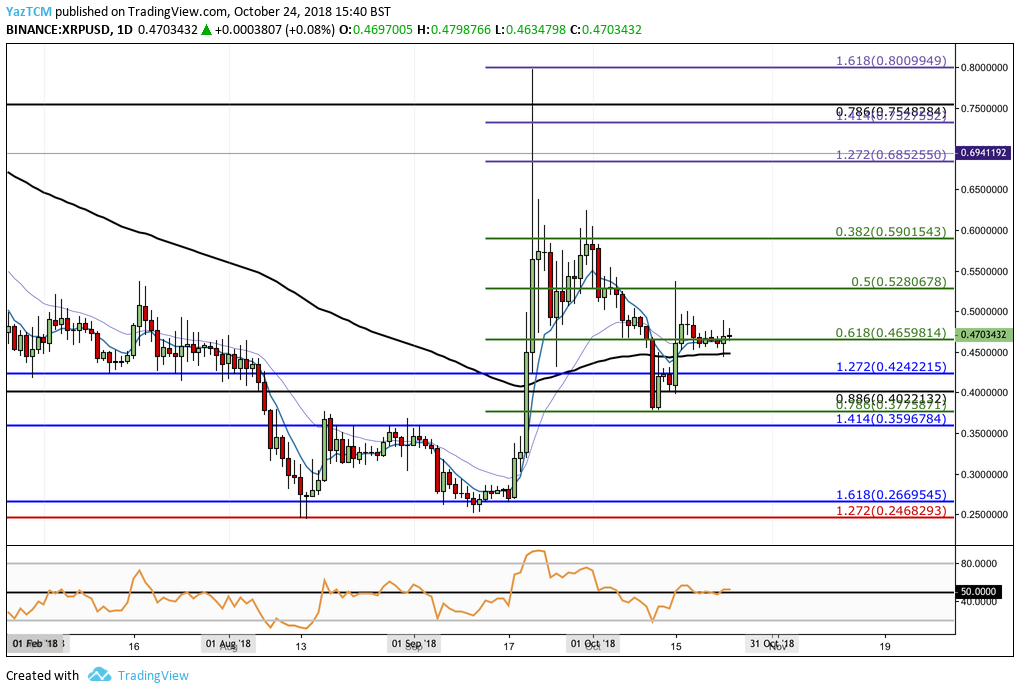
Assessing the market from the chart above, we can see that the market had reached more specific support at a short-term downside 1.618 Fibonacci Extension level (drawn in blue) priced at $0.2669 before reversing its previous downtrend.
Looking at the market with the benefit of a closer time scale, we can also immediately see the impact on the XRP/USD market from the announcement of the PNC bank partnership. Price action surged from a low of $0.2684 on September 18, 2018, the date of the announcement, and extended to a high of $0.7878 on September 21, 2018. This was a total price increase of 190% during the short 4-day period.
It is noticeable that as XRP/USD placed the high, it had met resistance at a 1.618 Fibonacci Extension level priced at $0.80 before rolling over and falling. The market continued to decline during the early part of October 2018 until reaching support at the short-term .786 Fibonacci Retracement level (drawn in green) priced at $0.3775, where the downturn stalled and reversed.
Price action has now been trading along support provided by the short-term .618 Fibonacci Extension level (drawn in green) priced at $0.4659. XRP/USD has been supported at this level for the past 10 days as the bulls gear up to push price action above the $0.50 handle once again.
What to Expect Moving Forward
If the bulls can push XRP/USD above $0.50, we can expect immediate significant resistance above at the short-term .5 Fibonacci Retracement level (drawn in green) priced at $0.5280.
Further resistance above this level can then be located at the .382 Fibonacci Retracement level (drawn in green) priced at $0.5901, followed by the short-term 1.272 Fibonacci Extension level (drawn in purple) priced at $0.6852.
If the bulls persist even higher, we can expect further resistance at the long-term .786 Fibonacci Retracement level (drawn in black) priced at $0.7548, followed by the 1.618 Fibonacci Extension level (drawn in purple) priced at $0.80.
On the other hand, if the bears step into the market and push price action below the support at $0.4659, we can expect immediate significant support below at the long-term .886 Fibonacci Retracement level (drawn in black), priced at $0.4022. Support located beneath this level can be expected at the short-term .786 Fibonacci Retracement level (drawn in green) priced at $0.3775, followed by the downside 1.414 Fibonacci Extension level (drawn in blue) priced at $0.3596.
If the bears persist to push XRP/USD even lower, more support beneath is expected at the downside 1.618 Fibonacci Extension level (drawn in blue) priced at $0.2669.
The RSI technical indicator has been trading along the 50 handle over the past couple of weeks, indicating that the bulls and the bears are battling for market control. If the RSI can break above the 50 handle, this would indicate that the bulls are in control of the market momentum and we could expect price action to increase.
Let us continue to analyze price action for XRP against BTC over the long term.
XRP/BTC – LONG TERM – DAILY CHART
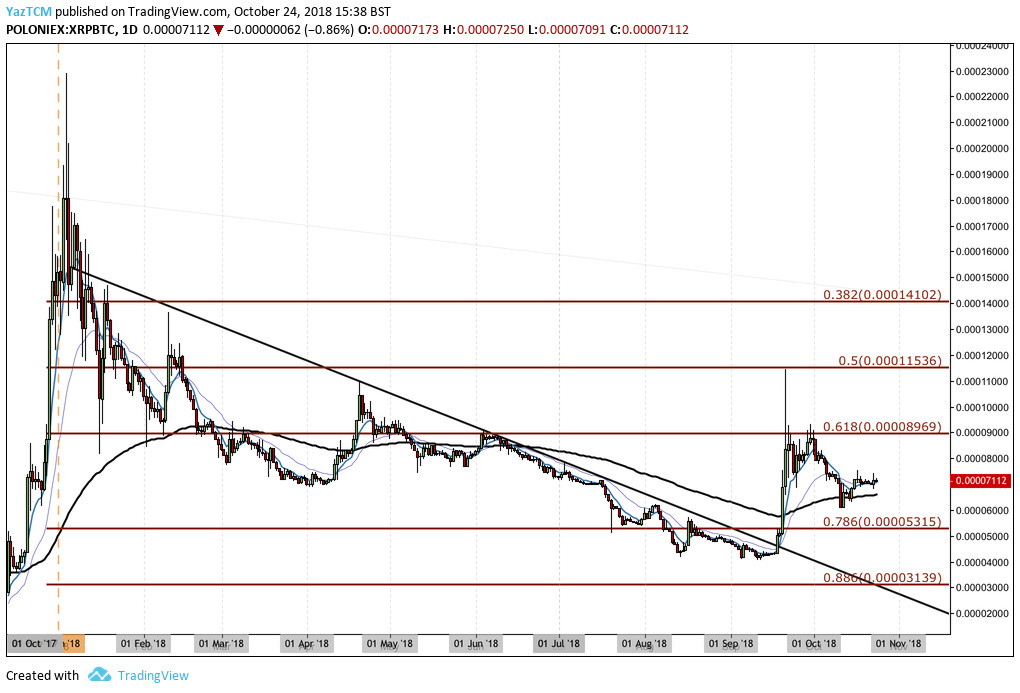
Taking a look at the Ripple market against Bitcoin, we can see the similar depressive trading year. Price action has consistently declined since the all-time high price of 22,888 SATS placed on January 4, 2018.
The market was trading underneath a strong downward sloping trend line for 8 and a half months out of the year until the partnership announcement caused XRP/BTC to finally break above this long-term trend line.
The market surge saw XRP/BTC rallying into resistance provided at the long-term .618 Fibonacci Retracement level priced at 8,969 SATS. Bulls failed to push price action above this level and price action has since pulled back slightly.
Let us continue to analyze price action a little closer over the shorter period and highlight any potential support and resistance areas moving forward.
XRP/BTC – SHORT TERM – DAILY CHART
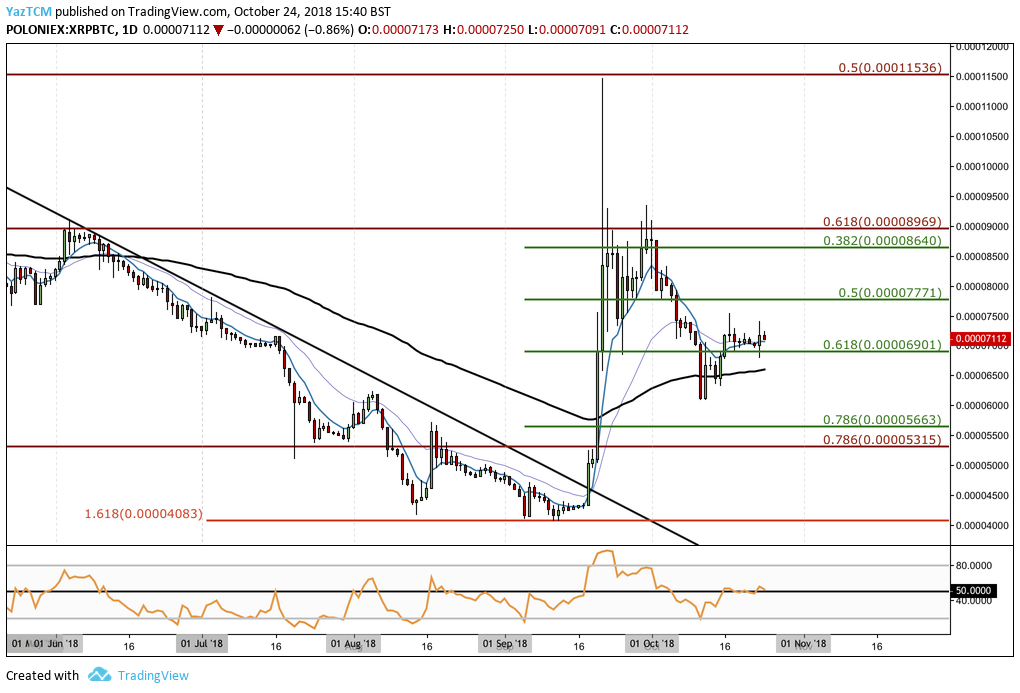
Analysing price action a little closer for XRP/BTC, we can see that the recent price surge had price action rise from a low of 4,313 SATS on September 18, 2018 to a high of 11,465 SATS on September 21, 2018.
Since placing the high, price action has rolled over and fallen, until finding support at the 100-day moving average during the first half of October 2018. Price action has since rebounded and is now trading at support provided by the short-term .618 Fibonacci Retracement level (drawn in green), priced at 6,901 SATS.
Moving forward, if the bulls can regather momentum and push price action higher, immediate significant resistance above can be expected at the .5 and .382 Fibonacci Retracement levels (drawn in green), priced at 7,771 SATS and 8,640 SATS respectively.
The bulls will then have to battle above the strong resistance at the long-term .618 Fibonacci Retracement level (drawn in red), priced at 8,969 SATS.
If the bulls can break above the 9,000 SATS handle, further resistance higher can then be expected at the .5 Fibonacci Retracement level priced at 11,563 SATS.
Alternatively, if the bears pressure price action beneath the support at 6,901 SATS, we can expect immediate support beneath to be located at the 100-day moving average which currently floats around the 6,500 SATS region. Further support beneath this can then be located at the long-term .786 Fibonacci Retracement level (drawn in red), priced at 5,513 SATS.
In the event that the bears penetrate below the support at 5,513 SATS, further support below can be expected at the previous downside 1.618 Fibonacci Extension level (drawn in red) priced at 4,083 SATS.