
Monero has seen a small price decline totaling 1.57% over the past 7 rolling days of trading. The cryptocurrency is currently exchanging hands at a price of $113.76, after seeing a further 6% price decline over the past 30 days of trading.
Monero was developed in April 2014, and was designed to be a cryptocurrency project that upholds the privacy of its users. It leverages a cryptographic technique known as Ring Signatures, which mixes users private account keys with public keys and create a ring of possible signers for the transaction. This way nobody looking in from the outside can tell who actually did sign the transaction.
The mining for Monero is also ASIC-resistant, meaning specialized chips cannot dominate the mining ecosystem for Monero. However, the combined use of privacy and the exclusion of specialized mining equipment does have some drawbacks to it. One of the most troublesome drawbacks involves mining malware/ransomware.
As mining is done by GPUs and CPUs, hackers can install Monero miners on their targets computers and benefit from exploiting other people’s resources. The Monero team have recently tried to combat this by releasing a Malware Response website, which details the best ways to remove and avoid this kind of attack.
Monero is currently ranked 10th in terms of overall market cap across the entire industry. It has a total market cap value of $1.87 billion after the 52-month old coin suffered a 20% price drop over the past 90 trading days. Monero is currently trading at a value that is 76% lower than its all-time high (ATH) price.
Let us continue to analyze price action for Monero over the long term and see how the market has been behaving.
Monero Price Analysis
XMR/USD – LONG TERM – DAILY CHART
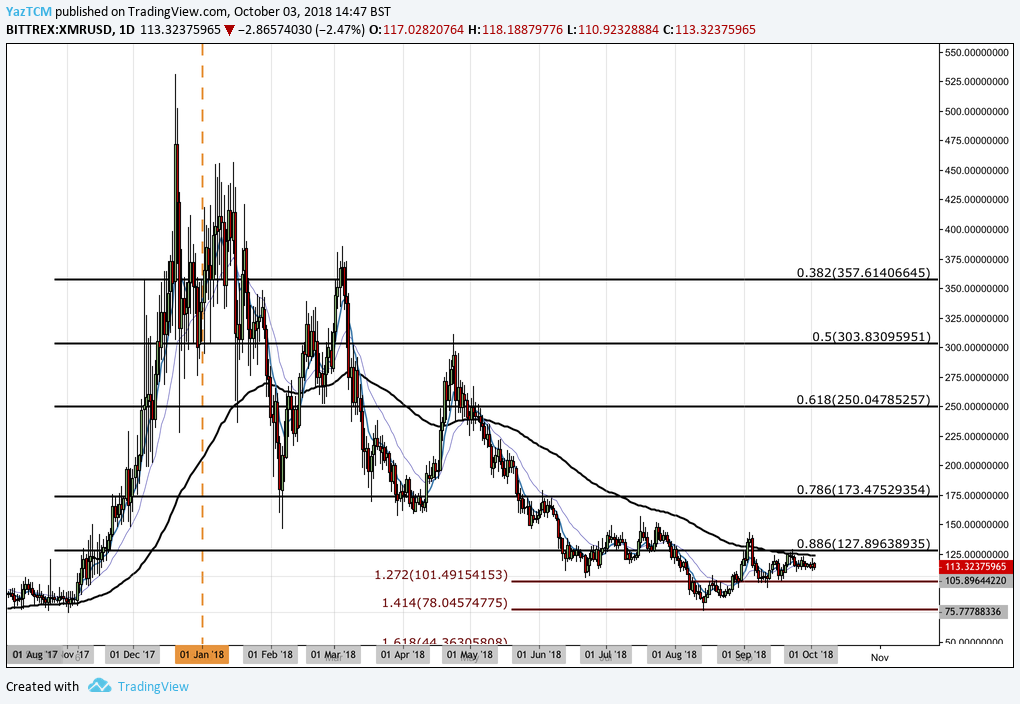
Analyzing price action from the long-term perspective above, we can see that Monero had experienced a significant bullish run toward the end of 2017 when price action started from a low of $74.77 on November 2, 2017 and extended to an ATH price of $531.27 on December 20, 2017. This was a price increase totaling 585% from low to high.
After placing the ATH, price action rolled over and began to decline. It had originally found a form of solid support at the .786 Fibonacci Retracement level priced at $173.47 during February 2018. This Fibonacci Retracement is measured from the entire bullish run outlined above.
We can see that price action continued to decline as the year progressed. August 2018 was a pivotal month for XMR as price action continued to fall to complete a 100% Retracement of the late-2017 bullish run.
We can see that the market had found support at the downside 1.414 Fibonacci Extension level priced at $78.04. As price action approached this area, we can see that the market reversed and began to rally.
Let us continue to analyze price action over the shorter term and highlight any potential support and resistance areas.
XMR/USD – SHORT TERM – DAILY CHART
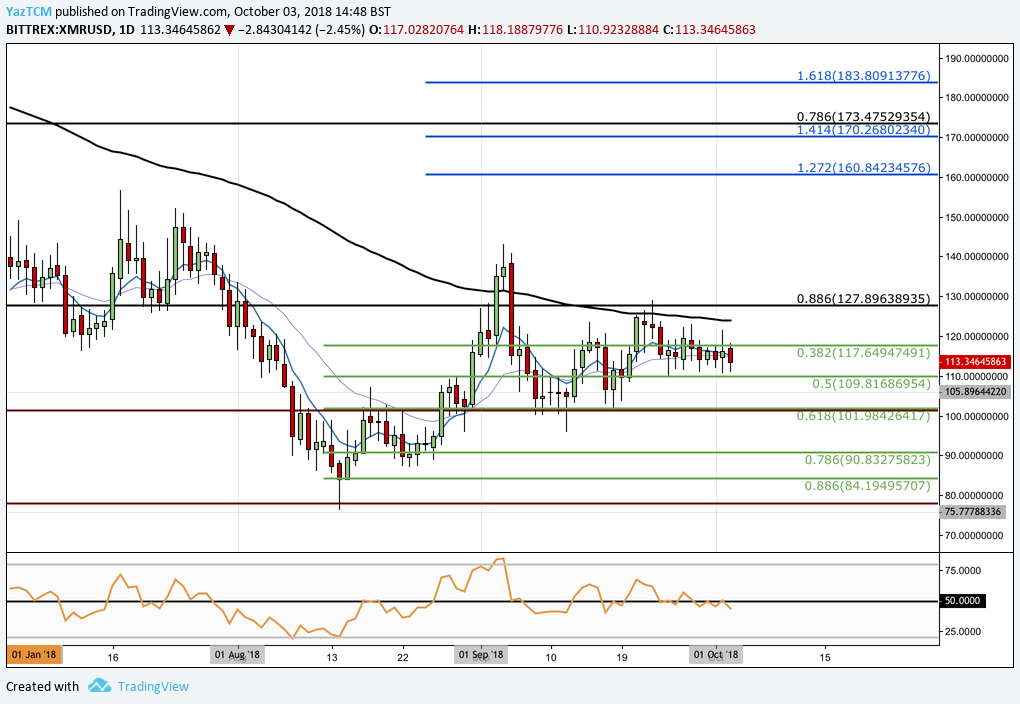
Analyzing the market from the short-term perspective above, we can see that after price action found support at the downside 1.414 Fibonacci Extension level priced at $78.04, the market rebounded and started to rally.
The market increased from a low of $76.36 on August 14, 2018 and extended to an intermediary high priced at $143.09 on September 4, 2018. This was a price increase totaling 85% from low to high.
We can see that the market has retraced slightly after placing this high. Price action had found support at the short-term .618 Fibonacci Retracement level (drawn in green) priced at $101.98. The market is now currently trading at resistance marked by the short-term .382 Fibonacci Retracement level priced at $117.64.
If the bulls can push price action above the resistance at $117.64, we can expect immediate significant resistance above to be located at the 100-day moving average, which is currently hovering around the $123 handle, followed by resistance at the long-term .886 Fibonacci Retracement level priced at $127.89.
Resistance expected above this area will then be expected at the September 2018 price high at $143.
If the bulls can continue on higher above $143, further resistance can then be expected at the 1.272 and 1.414 Fibonacci Extension levels (drawn in blue), priced at $160 and $170 respectively.
Alternatively, if the bears re-enter the market and push price action further lower, we can expect immediate support at the short-term .618 Fibonacci Retracement level (drawn in green) priced at $101.98. If the bears continue to pressure the price lower, then we can expect more support to be located at the short-term .786 and .886 Fibonacci Retracemenet levels, priced at $90.83 and $84.19 respectively.
If the bears continue to push the market even lower, then more support below can be expected at the previous long-term downside 1.414 Fibonacci Extension level priced at $78.04.
The technical indicators within the market have recently slipped into the favor of the bears at this current moment in time. The RSI is trading slightly below the 50 handle, indicating that the bears are beginning to take control of the momentum within the market. If the RSI continues to remain under 50, we may see this market continue further lower.
Let us continue to quickly analyze price action for XMR relative to BTC over the long term.
XMR/BTC – LONG TERM – DAILY CHART
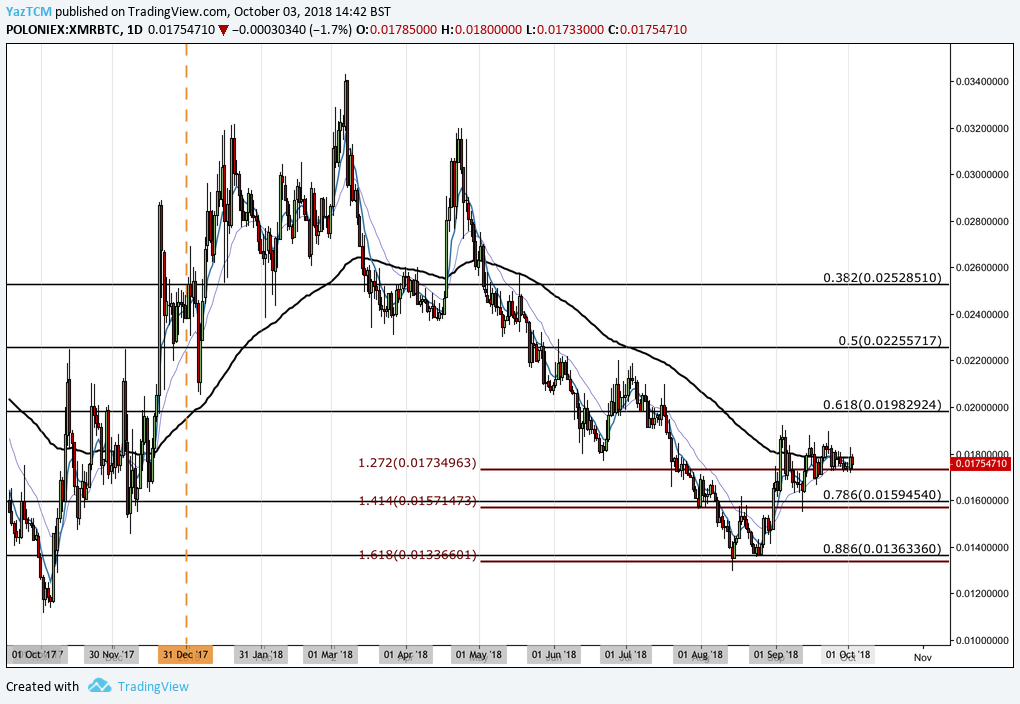
Analyzing price action from the long-term perspective above, we can see that the market had experienced a bullish wave when price action started from a low of 0.011152 SATS on November 2, 2017 and extended to an ATH price of 0.0342980 SATS on March 7, 2018. This was a price increase totaling 205% from low to high.
After placing the high, we can see that price action rolled over and began to decline significantly. It had recently found solid support at the .886 Fibonacci Retracement level priced at 0.0136336 SATS during August 2018. This Fibonacci Retracement is measured from the entire bullish run outlined above.
We can also see that the support at the .886 Fibonacci Retracement level was significantly bolstered by a downside 1.618 Fibonacci Extension level priced at 0.01336601 SATS.
As the market approached this combined area of support, it was rejected which caused price action to reverse and start to rally again. The market is now currently trading at support provided by the downside 1.272 Fibonacci Extension level priced at 0.017349 SATS.
If the bulls can continue to push price action higher, we can expect immediate resistance to be located at the .618 Fibonacci Retracement level priced at 0.01982924 SATS, followed by the .5 Fibonacci Retracement level priced at 0.02255717 SATS.
Alternatively, if the bears push price action lower, we can expect immediate support to be located at the .786 Fibonacci Retracement level priced at 0.01594540 SATS, followed by the .886 Fibonacci Retracement level priced at 0.01363360 SATS.