
- Monero has resisted breaking below $100 during October 2018.
- The market has recently met resistance at the 100-day moving average priced around $117.
- Support moving forward: $109.81, $101.98, $100, $90.83, $84.19, $76.62.
- Resistance moving forward: $117.64, $127.89, $143, $160.84, $170.26, $173.47, $183.80.
Monero has seen a small drop in price totaling 1.68% over the previous 24-hour trading session. The privacy-focused cryptocurrency is now trading at a price around $110, at the time of writing, after experiencing a 7-day price increase of 5%.
The Monero project continues to hold the 9th position in terms of market cap rankings and presently holds a total market cap value of $1.80 billion. XMR has seen a 90-day price increase amounting to 17.82% as the 54-month old coin now trades at a price that is 78% lower than its all-time high price.
Let us continue to analyze price action for XMR/USD over the short term and proceed to highlight any areas of potential support and resistance.
Monero Price Analysis
XMR/USD – SHORT TERM – DAILY CHART
For a long-term outlook on Monero, we recommend re-visiting our last XMR article as our long term outline is still in play.
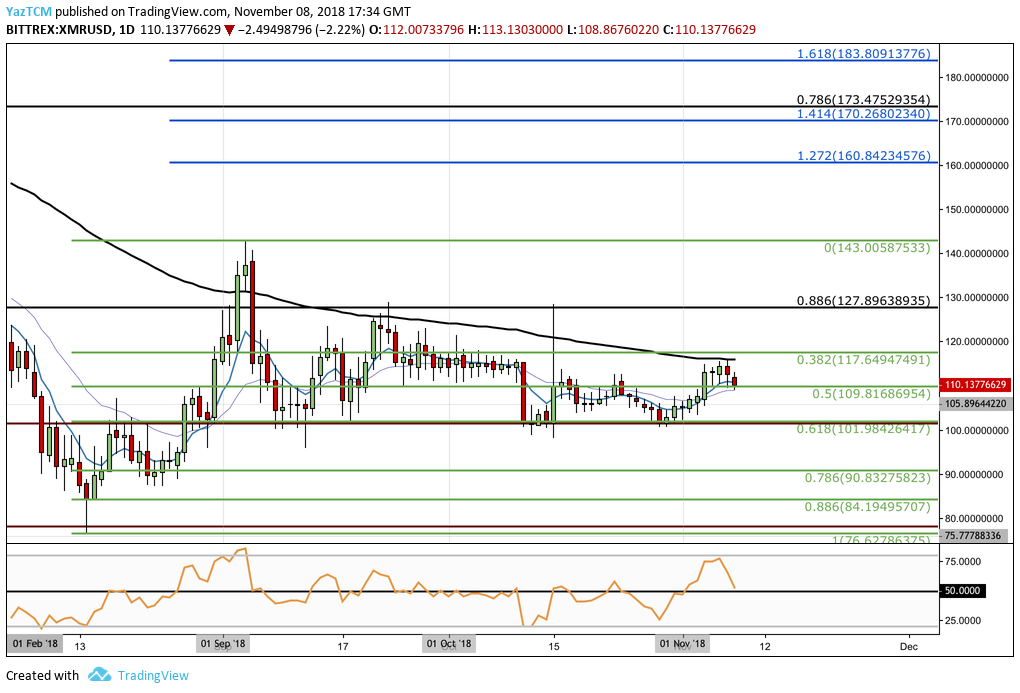
Analzsing price action from the short-term view above, we can see that the market is still trading within the range of its previous swing leg. Price action began at a low of $76.36 on August 14, 2018 and rose to a high of $143.09 on September 4, 2018. This was a total price increase of 86% from low to high.
Since our last analysis, price action went on to drop to find support at our expected short-term .618 Fibonacci Retracement level (drawn in green) priced at $101.98 during mid-October 2018.
This support level was deemed to be significant due to the downside 1.414 FIbonacci Extension level (drawn in red) being located within the same price area, along with the psychological support provided at the $100 round number handle. This combined level of support prevented price action for XMR/USD breaking beneath the $100 handle during both September and October 2018.
We can see that the recent price rise witnessed during November 2018 had met resistance at the 100-day moving average before reversing. Price action has since retraced slightly, and is now trading at support provided by the short-term .5 Fibonacci Retracement level (drawn in green) priced at $109.81.
Looking ahead, in our bearish scenario, if the sellers continue to pressure the market below the support at $109.81, we can expect immediate significant support beneath to be located at the combined support around the short-term .618 Fibonacci Retracement level priced at $101.98.
If the bears continue to break below the $100 handle, we can then expect further support beneath to be located at the short-term .786 and .886 Fibonacci Retracement levels (drawn in green), priced at $90.83 and $84.18 respectively. The final level of lower support to highlight is the August 2018 low around the $76.36 handle.
On the other hand, in our bullish outline, if the bulls can prevent XMR/USD from dropping below the support at $109.81 and drive price action higher, we can expect immediate resistance above to be located at the 100-day moving average and the .382 Fibonacci Retracement level (drawn in green) priced at $117.64.
If the bulls can then continue to push the market higher, then further resistance above can be located at the long-term .886 Fibonacci Retracement level (drawn in black) priced at $127.89. We can see that price action has not managed to break above this resistance level since early September 2018 so significant momentum will be needed to break above.
If the bullish momentum allows for XMR/USD to travel even further higher, then we can expect that the next level of contention will be located at the September 2018 high priced at $143.09, followed by the short-term 1.272 and 1.414 Fibonacci Extension levels (drawn in blue), priced at $160.84 and $170.26 respectively. The final level of resistance to highlight is the 1.618 Fibonacci Extension level (drawn in blue) which is located at the $183.30 handle.
The RSI has recently returned toward the 50 handle after trading at overbought conditions. This could indicate that the bearish momentum has faded, giving the opportunity for the bulls to take over. So long as the RSI can remain above 50, we can assume that the bulls are in control of the market momentum and will aim to drive XMR/USD higher.
Let us continue to analyze XMR/BTC over the short term and highlight areas of potential support and resistance.
XMR/BTC – SHORT TERM – DAILY CHART
Similarly, for a long term overview of XMR/BTC we recommend re-visiting the relevant section in our previous XMR price analysis.
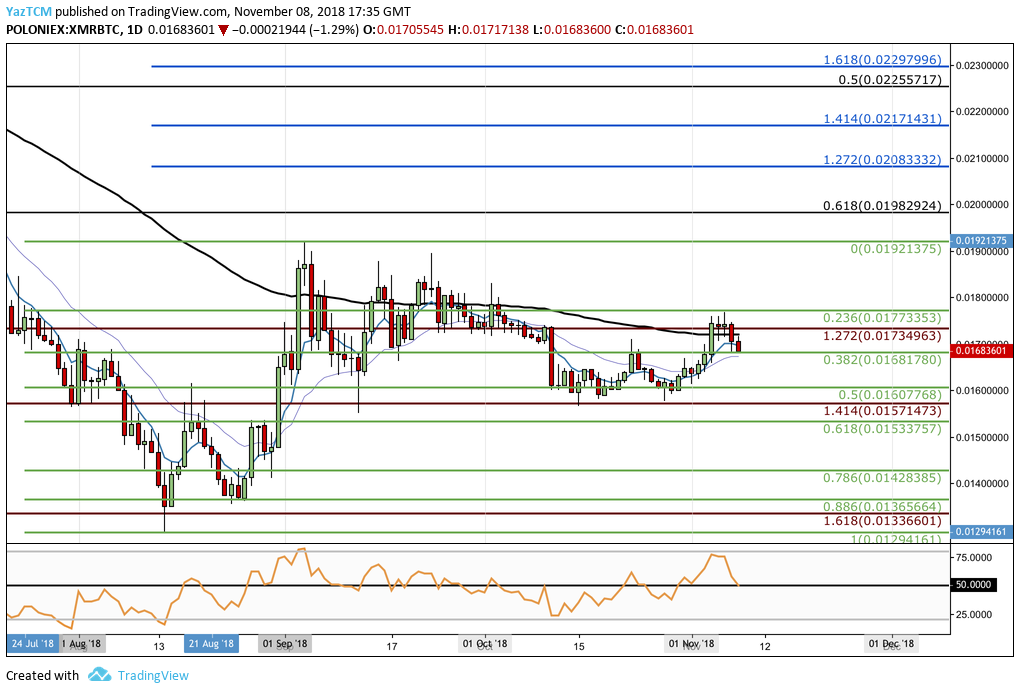
In the short term, price action for XMR/BTC had seen a price surge akin to that of XMR/USD. The market started at at low of 0.01295 SATS on August 14, 2018 and rose to a high of 0.01922 SATS on September 4, 2018, creating a 48% increase in price.
The market went on to find support at our highlighted short-term .5 Fibonacci Retracement level (drawn in green) priced at 0.016077 SATS during October 2018. The recent XMR/BTC price rise in November 2018 had seen price action rise to resistance at the .236 Fibonacci Retracement level (drawn in green) priced at 0.017733 SATS before retracing.
The market is now trading at support provided by the short-term .382 Fibonacci Retracement level (drawn in green) priced at 0.0016817 SATS.
The market looks like it will break below this support before being able to travel higher. In this case, we can expect immediate significant support below to be located at the .5 Fibonacci Retracement level (drawn in green) priced at 0.01607 SATS, followed by the previous downside 1.414 FIbonacci Extension level (drawn in red) priced at 0.015714 SATS.
If the sellers continue to force XMR/BTC further lower, we can expect support beneath to be located at the .618 and .786 Fibonacci Retracement levels, priced at 0.015337 SATS and 0.014283 SATS respectively. The final level of significant support to highlight lies at the downside 1.618 Fibonacci Extension level (drawn in red) priced at 0.013366 SATS.
Alternatively, in our bullish scenario, if the bulls re-enter the market and push price action higher, we can expect immediate resistance above to be located at the .236 Fibonacci Retracement level priced at 0.017733 SATS.
If the buyers can then continue to climb above the September 2018 high priced at 0.01922, we can expect further resistance above to be located at the long-term .618 FIbonacci Retracement level (drawn in black) priced at 0.01982 SATS, followed by the short-term 1.272 and 1.414 Fibonacci Extension levels (drawn in blue), priced at 0.020833 SATS and 0.021714 SATS respectively.
The RSI has also returned to the 50 handle, as we wait for the market to show its next move. If the RSI breaks below the 50 handle ,we could see this market head further lower before being able to restart its ascension.