
Tron has seen a small price decline totaling 1.38% over the past 24 hours of trading. The cryptocurrency is currently exchanging hands at around $0.0220, after suffering a further 2.15% price decline over the past 7 trading days.
Tron, the decentralized cryptocurrency dedicated to becoming a content sharing platform, has been receiving a wave of headlines over the past few months. Some key milestones include Tron migrating away from Ethereum to Justin Sun, CEO and founder of Tron, acquiring the 100 million strong user base of BitTorrent.
The team has recently released some information on the next move for BitTorrent which they have dubbed “Project Atlas.” With Project Atlas, Tron will be integrated into the BitTorrent platform, incentivizing users with high upload speeds to share files for longer.
The Tron team have also recently released a crowdfunding platform known as SEEDGerminator. This allows dapp developers to post their project and receive funding from the community.
Tron is currently ranked 13th in terms of overall market cap across the entire industry. It currently has a total market cap value of $1.22 billion after the cryptocurrency saw a precipitous 45% price decline over the past 90 trading days. Tronix is still trading at a price that is around 91% lower than its all-time high value.
Let us continue to analyze price action for Tron over the long term.
Tron Price Analysis
TRX/USD – LONG TERM – DAILY CHART
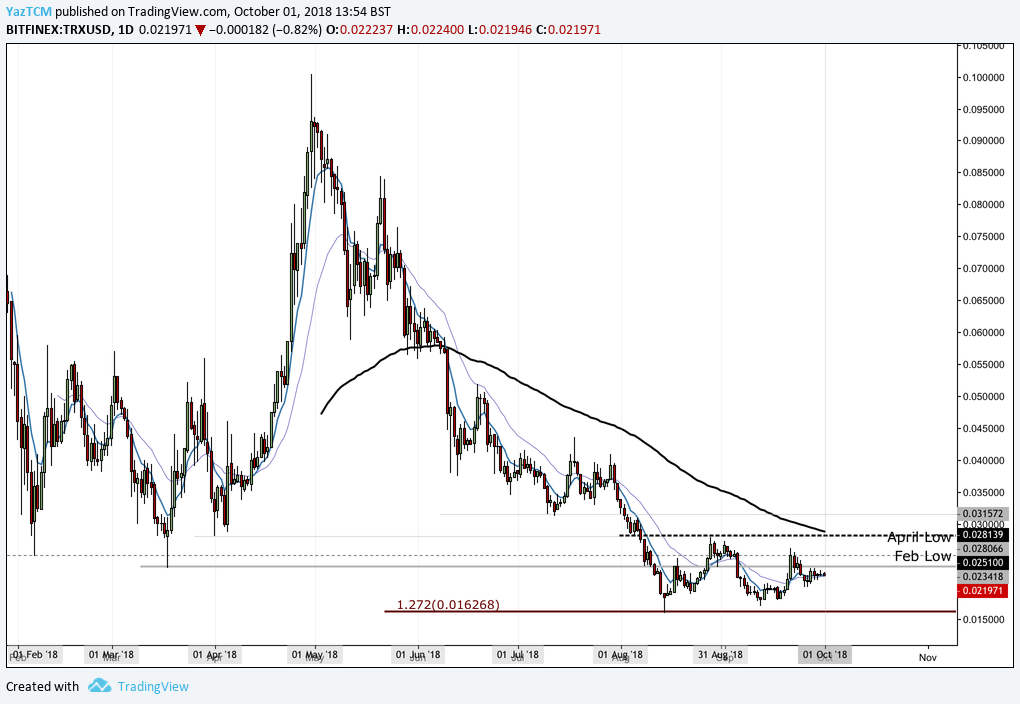
Analyzing the market from the long-term perspective above, we can see that price action had experienced a bullish run when the market started from a low of $0.0023 on March 18 2018 and extended to an all-time high of $0.10 on April 30 2018. This was a price increase totaling 320% from low to high.
We can see that after placing the all-time high, price action began to drop significantly. August 2018 was a disastrous month for the price of TRX as the market collapsed below the March 2018 $0.023 starting price of the bull run.
The market continued to fall lower during August 2018, until some form of support was found at a downside 1.272 Fibonacci Extension level priced at $0.01626. We can see that as the market approached this level it was rejected, causing price action to reverse.
Price action is still currently trading below the initial starting price of the bullish run seen during March/April 2018.
Let us continue to analyze price action for TRX a little closer over the short term and update any potential support and resistance areas.
TRX/USD – SHORT TERM – DAILY CHART
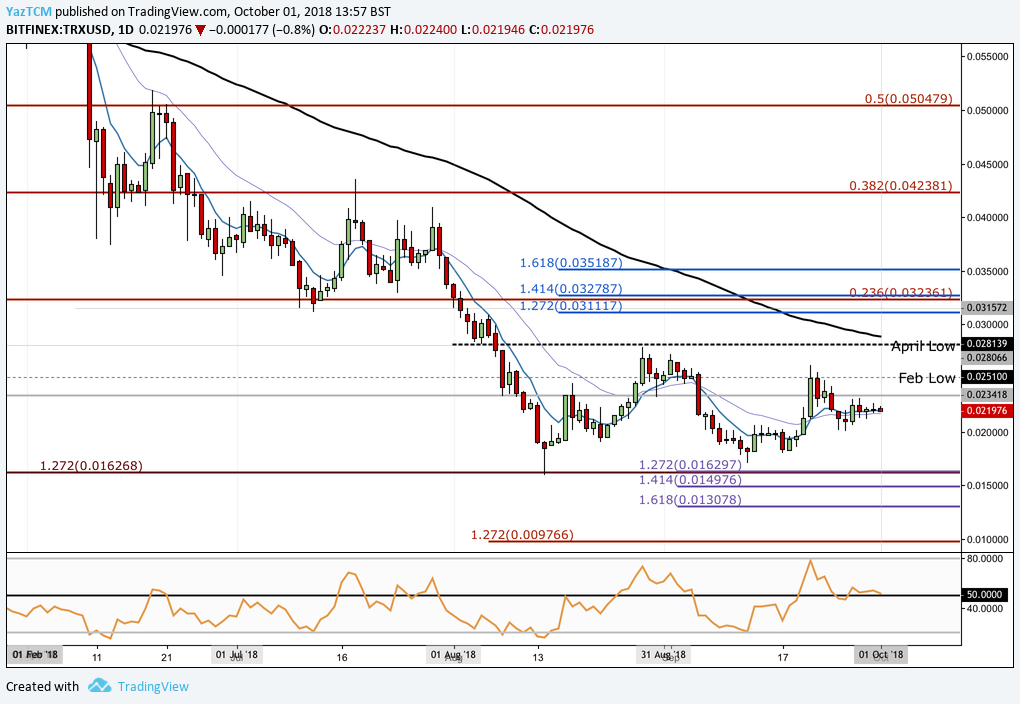
Analyzing price action from the short-term perspective above, we can see that after price action reversed during August 2018, it continued to rally until meeting resistance provided by the April 2018 low priced at $0.028139. After meeting this resistance, price action rolled over and began to decline once again.
The market is currently trading at a price around $0.2197. If the bullish pressure can re-enter the market at this price level and continue to push price action above $0.023, we can expect immediate higher resistance to be located at $0.02510, which is the February 2018 price low.
Further expected resistance above this level will then be expected at the April 2018 price low at $0.028139. This area of resistance is expected to be significant due to the 100-day moving average being located within this area, adding further to the expected resistance.
If price action can continue above the 100-day moving average, we can expect further resistance higher to be located at the long-term bearish .236 Fibonacci Retracement level priced at $0.032361, followed by the short-term 1.618 Fibonacci Extension level (drawn in blue) priced at $0.035187.
The technical indicators within the market are currently producing neutral readings. The RSI trades along the 50 handle, indicating that the market players are still deciding which way the momentum will swing toward next. If the RSI can break above the 50 handle, we can continue to expect this market to make further gains.
Let us continue to analyze price action even closer on the 4-hour time frame to highlight any potential support areas moving forward.
TRX/USD – SHORT TERM – 4HR CHART
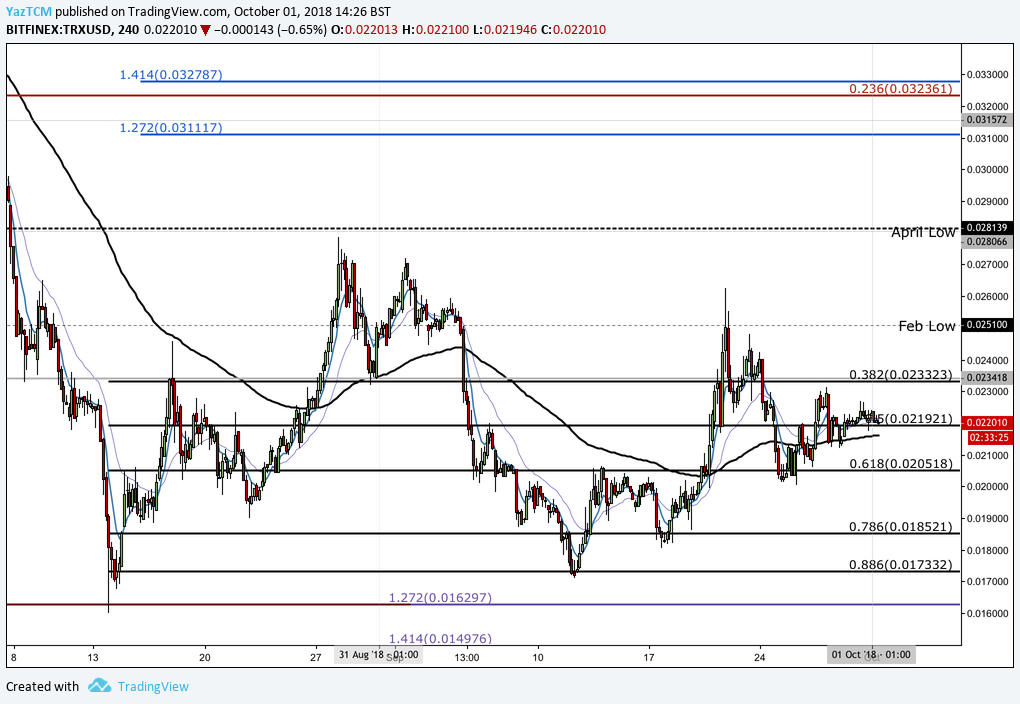
Analyzing the market from the short-term 4-hour chart above, we can clearly see the recent bullish swing for TRX. The market started from a low of $0.016 on August 14, 2018 and extended to a high of $0.02787 on August 28, 2018. This was a price increase totaling 72% from low to high.
After placing the high, we can see that price action continued to roll over and decline. The market continued to decline until reaching support at the short-term .886 Fibonacci Retracement level priced at $0.017332. This Fibonacci Retracement is measured from the short-term bullish run outlined in the paragraph above.
After hitting support at the $0.017332 handle, the market reversed and started to rally. It is currently trading at the .5 Fibonacci Retracement level priced at $0.02192.
If the bears enter the market and continue to push price action lower, we can expect immediate support below to be located at the .618 FIbonacci Retracement level priced at $0.020518. Further support below this can then be expected at the .786 and .886 Fibonacci Retracement levels priced at $0.018521 and $0.017332, respectively.
If the bearish sentiment can continue even further below this level, then we can expect more resistance to be located at the short-term downside 1.272 Fibonacci Extension level (drawn in purple) priced at $0.01629.
Let us continue to analyze the market from TRX relative to BTC over the long term and highlight any potential support and resistance areas.
TRX/BTC – LONG TERM – DAILY CHART
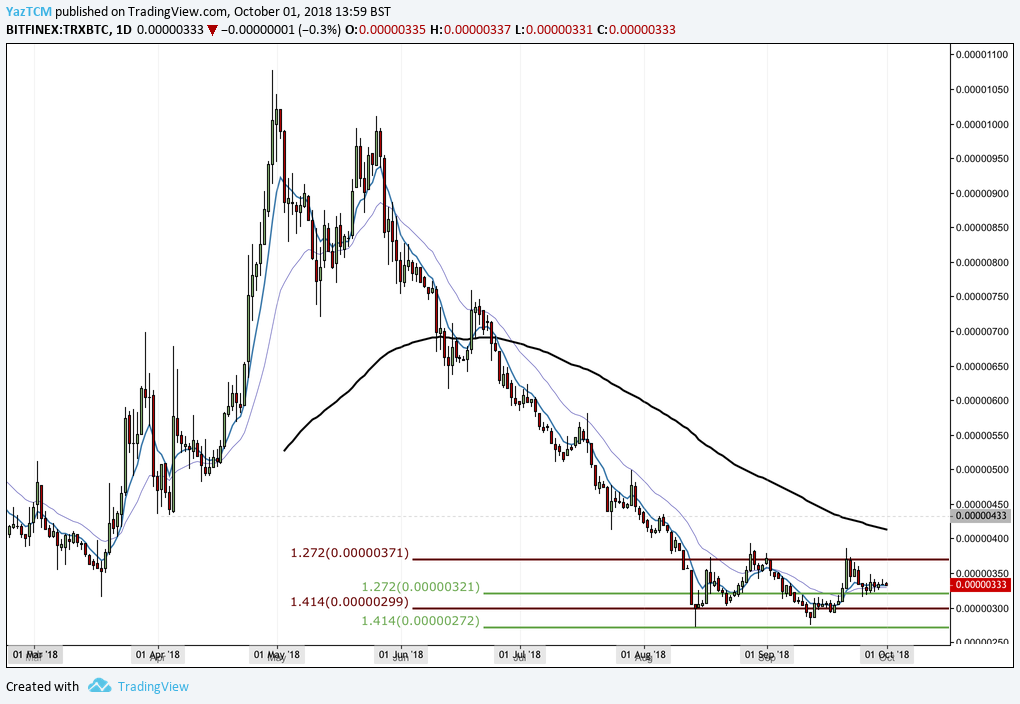
Analyzing the market from the long-term perspective above, we can see that TRX had experienced an incredible bullish wave against BTC. The market started from a low of 434 SATS on April 4, 2018 and extended to an all-time high of 1,078 SATS on April 30, 2018. This was a price increase totaling 235% from low to high.
After placing the high, we can see that the market rolled over and began to decline. We can see that it continued to decline for the majority of the year, only recently finding a form of support during August 2018, at the downside 1.414 Fibonacci Extension level (drawn in green) priced at 272 SATS.
After the market reached this support level, it was rejected and price action then began to trade sideways.
We can see that for the past 6 weeks or so, the market has been trapped within a range-bound condition between the downside 1.272 Fibonacci Extension level (drawn in red) priced at 371 SATS as the upper boundary of the range and the downside 1.414 Fibonacci Extension level (drawn in green) priced at 272 SATS as the lower boundary of the range.
If the bears enter the market and pressure price action lower, we can expect immediate support to the downside 1.272 FIbonacci Extension level (drawn in green) priced at 321 SATS, followed by the downside 1.414 Fibonacci Extension level (Drawn in red) priced at 299 SATS.
If the bears continue even further lower, then we can expect more support for the market at the lower boundary of the trading range priced at 272 SATS.
Alternatively, if the bulls re-enter the market and push price action higher, we can expect immediate resistance to be located at the upper boundary of the range priced at 371 SATS.
If the bulls can penetrate above the upper boundary, then more resistance can be expected at the 100 day moving average level which currently is hovering around the 410 SATS handle. Even more resistance higher can then be expected at psychological round number handles of 450, 500 and 600 SATS.
Related: 10 Altcoins to Watch in Q4 2018