
Tron has experienced a brief period of bullish momentum as the cryptocurrency rises by a total of 4.35% over the past 24 hours. TRX, the cryptocurrency behind Tron, is currently trading at a price of $0.0345, at the time of writing, after experiencing a tough week of trading as TRX dropped by 9.28% over the past 7 trading days.
Tronix was created by Justin Sun, former Ripple representative, and was intended to become a decentralized content sharing platform which would allow content creators to retain control of their own content. After launching its blockchain and migrating to its own mainnet blockchain Tronix has enjoyed a smooth migration as 19 major cryptocurrency exchanges have completed the process. This now allows users to withdraw and access their TRX coins once again.
Along with their recent migration, Tronix is undergoing a Super Representative election, have released access to store coins easily in cold storage through the Ledger Nano and are looking forward to the official launch of their network known as the Tron Virtual Machine, set to launch toward the end of July. For more information regarding Tron, we recommend our “What is Tron” guide.
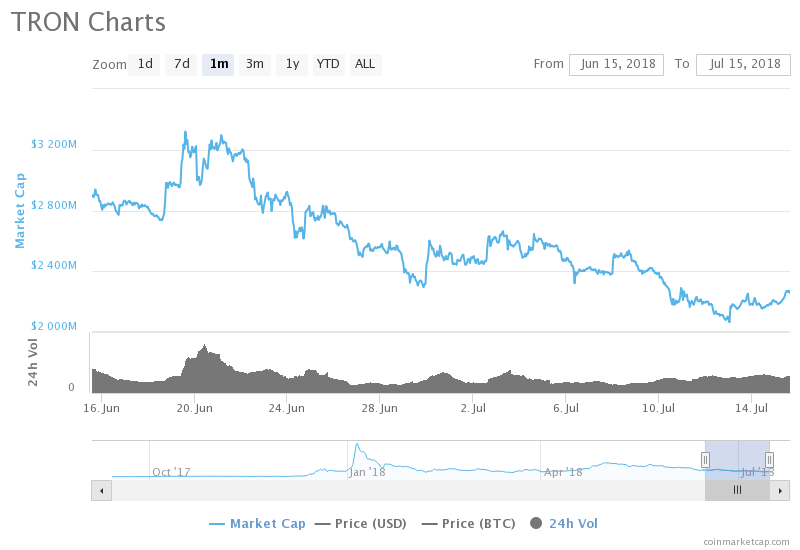
The 10-month old coin, Tron, is currently ranked at 11th place in terms of overall market cap across the entire industry, with a total market cap value of $2.27 billion. This is $1.09 billion lower than the market cap high of $2.27 witnessed on June 19, 2018, as indicated by the chart below. TRX has experienced a drop of 22.61% over the past 30 trading days.
Let us continue to analyze Tron price action over the course of its short life span.
Price Analysis
TRX/USD – SHORT TERM – DAILY CHART
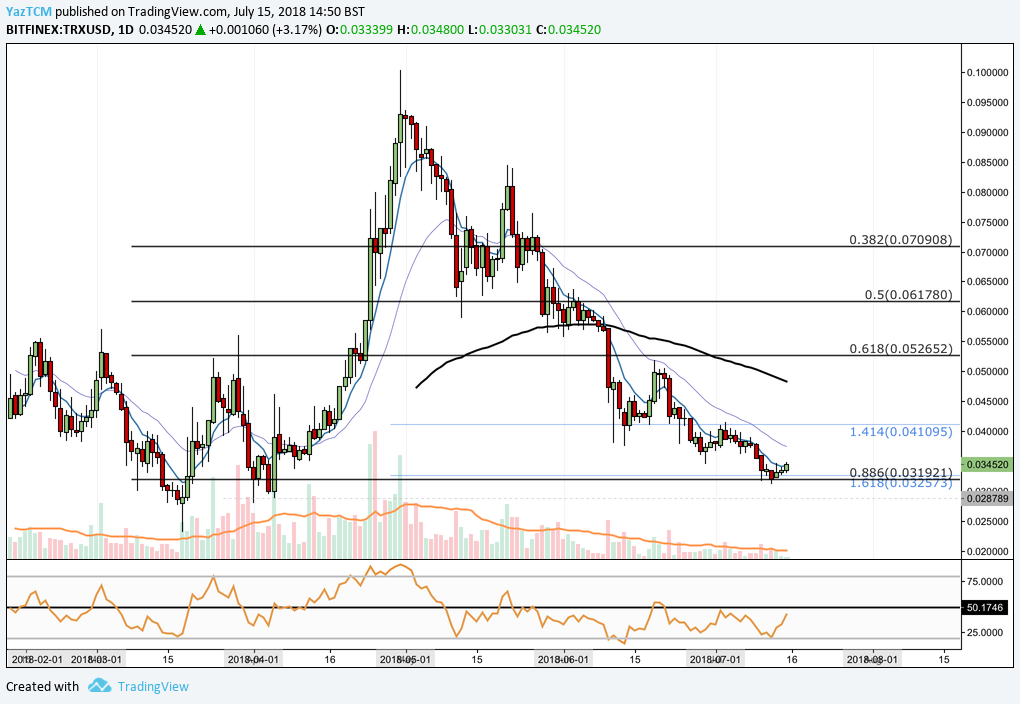
https://www.tradingview.com/x/gRAWC2Cc/
Analyzing the chart from the short time of data points available, we can see that Tronix had experienced a strong bullish run starting from March 18, 2018 when price action increased from a low of $0.023 and rose to an all-time high of $0.100 on April 30, 2018. This was a price increase of over 320% from low to high.
After placing this all-time high, the market went on to depreciate, originally finding support at the .50 Fibonacci Retracement priced at $0.061 during May 2018. This is a Fibonacci Retracement taken from the entire bullish run described above.
The market went on to break below the .50 Fibonacci Retracement during June 2018 and subsequently penetrated far below the 100-day moving average and the .618 Fibonacci Retracement priced at $0.052, until it found support at a downside 1.414 Fibonacci Extension priced at $0.041. This is a downside Fibonacci Extension taken from the initial bearish leg seen during May.
Price action continued on its bearish trajectory during July until it found support, recently, at the .886 Fibonacci Retracement priced at $0.031. The market found support at this level and rebounded to where it is currently trading around $0.034. It is important to highlight that the downside 1.618 Fibonacci Extension is also located within this area adding to the expected support within this area.
If the bullish momentum witnessed over the past 24 hours can continue and eventually push the market above the 21 day moving average (drawn in purple), then near-term resistance can be located at the 1.414 Fibonacci Extension level priced at $0.041. This area is also home to the .786 Fibonacci Retracement (not indicated on the chart) adding to the resistance expected in this area. Further resistance can be found at the 100-day moving average (black line), the $0.050 psychological round number handle and lastly the .618 Fibonacci Retracement priced at $0.052.
Alternatively, if the market experiences resumed bearish pressure and breaks below the .886 Fibonacci Retracement, then near-term support can be located around the lows of April near $0.028, followed by the all-time low of $0.023.
The technical indicators are beginning to show some signs of promise toward the bulls in the market. The RSI is currently making its way to the 50 handle — if it can break above the 50 level, then this would serve as a signal that the bulls are starting to increase momentum within the market. The RSI has failed to break above the 50 handle for over 3 months now highlighting the challenge ahead for RSI to achieve this.
Let us continue to analyze how TRX has been performing against Bitcoin over the same period.
TRX/BTC – SHORT TERM – DAILY CHART
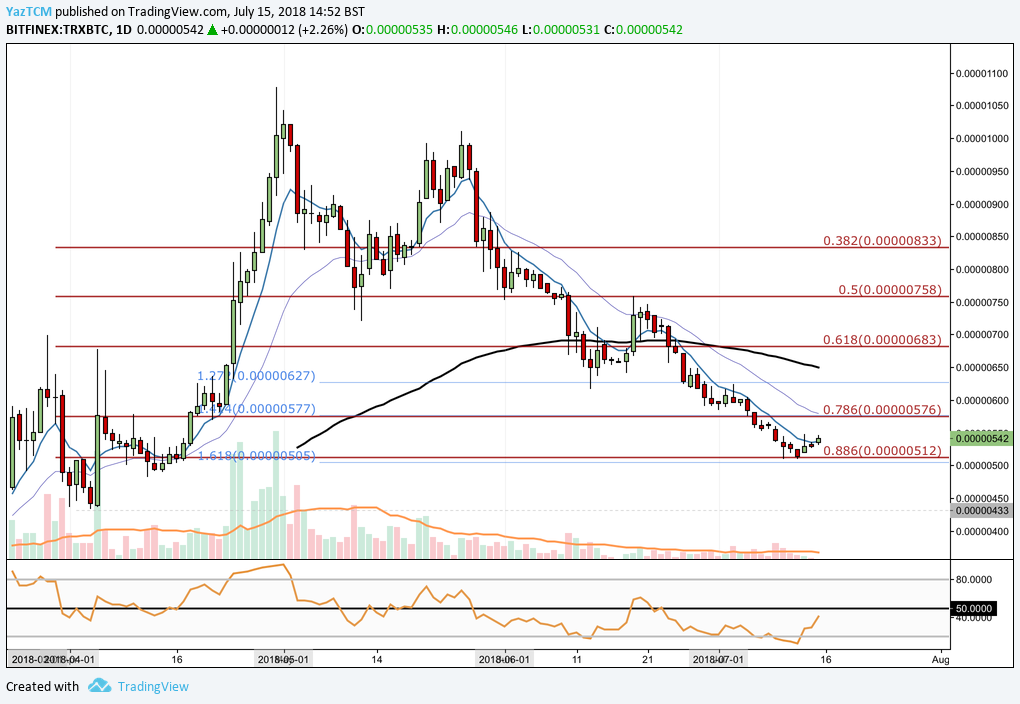
https://www.tradingview.com/x/2id2oHjh/
Analyzing the market above, we can see that TRX had experienced a bullish run relative to Bitcoin starting from a low of 434 SATS on April 4, 2018 and extending all the way to an all-time high of 1,078 SATS placed on April 30, 2018. This was a price increase of 235% from low to high.
The market went on to fall after placing this all-time high to where it is currently trading at the .886 Fibonacci Retracement priced at 512 SATS. This is a Fibonacci Retracement of the bullish run outlined above.
If the bullish momentum can push the market above the .786 Fibonacci Retracement priced at 576 SATS, then the nearest level of significant resistance will come at the 100-day moving average (black line) around the 650 SATS price range. Further resistance will be located at 683 SATS which is the .618 Fibonacci Retracement level. This level provided significant support for the market during June 2018 so it is expected that this will be a level of significant resistance.
The technical indicators are still in bearish territory within this market — however, the indicators are starting to lean further toward the bulls each session. The RSI is currently trading toward the 50 handle after trading in oversold conditions below the 20 handle for some time. If the RSI breaks above 50, this would indicate that the bullish momentum is building.
Similarly the moving averages have started to indicate a potential reversal as the steepness of their line flattens. The 7-day EMA (blue line) is currently trading horizontally — if the bullish momentum can cause the 7-day EMA to turn toward and eventually break above the 21-day EMA (purple line), this would signal a bullish crossover indicating that a bullish trend is beginning to form.
Conclusion
Over the short period that Tron has been trading it has experienced a number of significant successful events from the activation of its mainnet to its migration away from Ethereum.
We will be analyzing price action over the remainder of the month to see if the indicated support levels can hold.
With such a polarizing figure at the head of the Tronix project it is difficult not to remain interested in the projects progress. There is still a long road ahead for the Tronix team as we look forward to future releases.