Stellar has experienced another price hike totalling 6.61% over the past 24 hours of trading. The cryptocurrency is currently exchanging hands at $0.3221 at the time of writing, and has seen a 6.44% price surge over the past 7 trading days.
One of the top 10 cryptocurrencies, it was created by Jeb McCaleb, when he forked Stellar from Ripple in 2014. The Stellar network is intended to become a financial platform that enables low cost interbank transactions across countries in less than 5 seconds.
The network connects individuals, institutions and payment systems creating a financial system that can reach all the corners of the globe. One of the missions of the Stellar Development Foundation is to provide the unbanked with access to the financial world.
For more information on Stellar and its differences from Ripple, we recommend our guide to Stellar vs Ripple.
Stellar has received an overwhelming level of support from exchanges and corporations alike. Stellar is already partnered with IBM and the consulting firm Deloitte. Exchanges such as KuKoin and Huobi have recently added Stellar to their exchange.
Along with this, Coinbase had announced on July 13, 2018 that they were exploring adding Stellar to their exchange over the following months. This announcement caused the price of Stellar to surge by a total of 15%, and could even be considered the primary driver that helped Stellar resume its recent bull run.
Stellar is currently ranked 6th in terms of overall market cap across the entire industry, with a total market cap value of $6.04 billion. The top 10 cryptocurrency has experienced a significant price surge totalling 68.22% over the past 30 trading days.
Let us continue to analyze price action over the long run for Lumens (XLM), the cryptocurrency behind Stellar.
Price Analysis
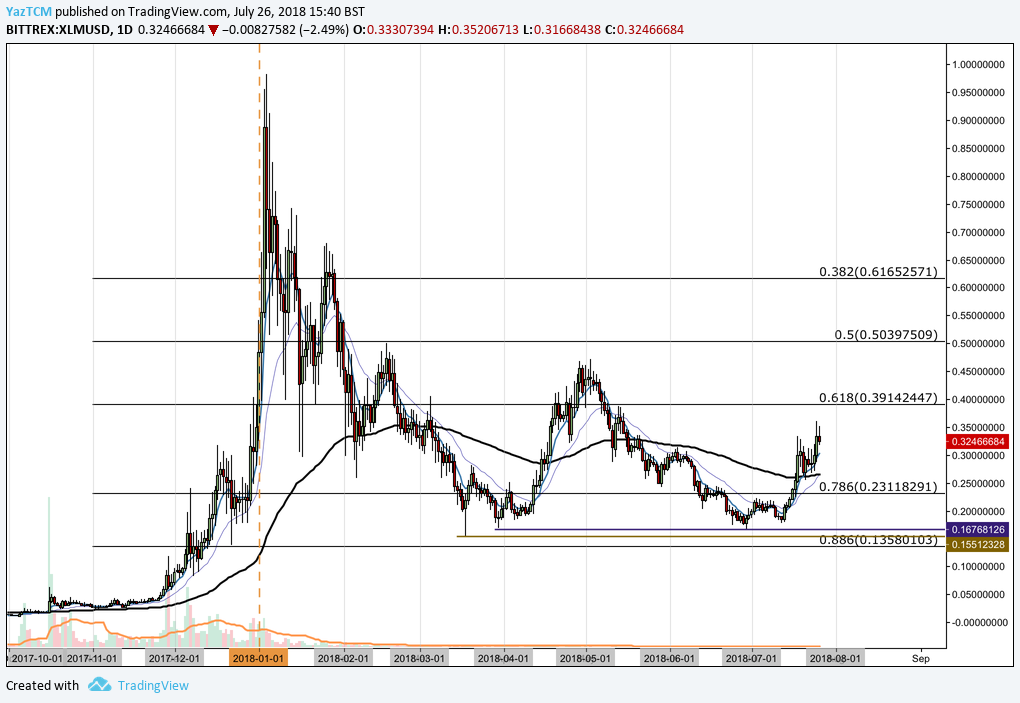
XLM/USD – LONG TERM – DAILY CHART
https://www.tradingview.com/x/J3Etbo4w/
Analyzing the market from the long-term perspective above, we can see that XLM had experienced a significant price increase when price action started from a low of $0.0208 in November 5, 2017 and rose to an all-time high of $0.09823 placed on January 4, 2018. This was a price increase totalling 2,350% from low to high.
After placing the all-time high, the market began to depreciate, originally finding support at the .618 Fibonacci Retracement priced at $0.39 during January. This is a Fibonacci Retracement measured from the total bullish run previously mentioned.
The market went on to fall below the .618 Fibonacci Retracement in February, and consequently fell through the 100-day moving average. Price action continued to fall over the following month, March, until reaching a yearly low priced at $0.155 just above the .886 Fibonacci Retracement priced at $0.13.
Let us continue to analyze price action over the more recent period to highlight any potential support and resistance areas.
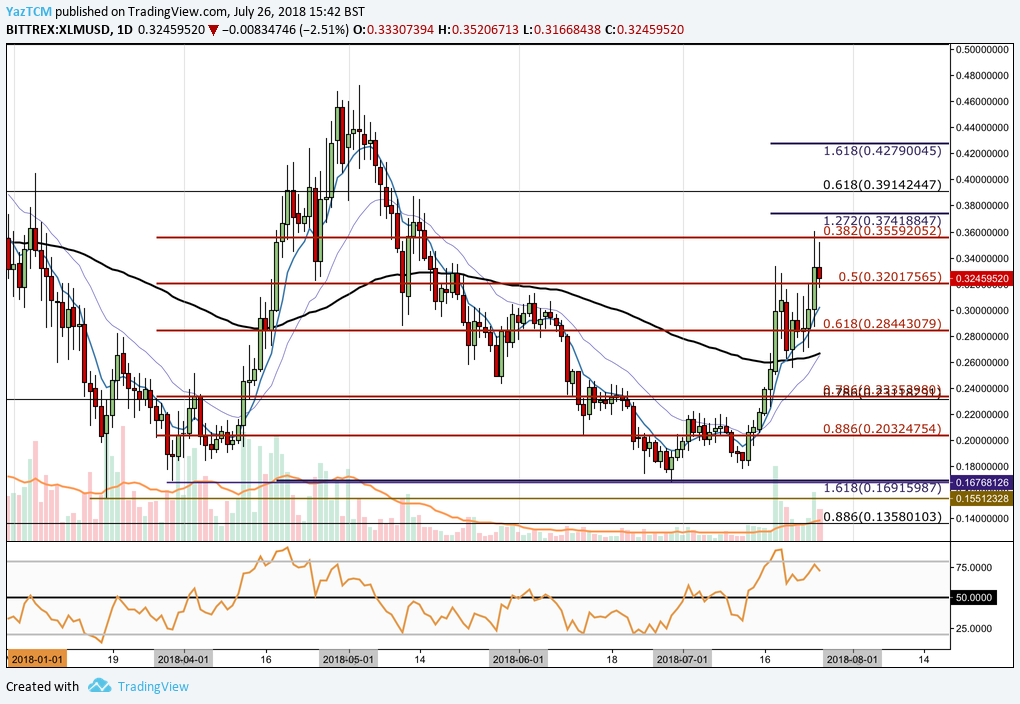
XLM/USD – SHORT TERM – DAILY CHART
https://www.tradingview.com/x/200QHTvP/
Looking at the market from a closer perspective, we can see that, during April, price action went on to create another bullish run. In this smaller bullish run, price action started from a low of $0.1679 on March 30, 2018 and extended to a high priced at $0.4723 on May 3, 2018. This was a price surge totalling 180% from low to thigh.
Price action went on to fall during May, initially finding support at the short-term .50 Fibonacci Retracement (marked in red) priced at $0.32. This is a short term Fibonacci Retracement measured from the bullish run mentioned in the paragraph above. However, the market could not sustain itself above this level and continued lower, below the 100-day moving average until the .618 Fibonacci Retracement priced at $0.2844.
As June began trading, the marked tanked further, eventually completing a 100% retracement from the bullish run during April. The price low of April, at $0.1676, provided ample support as the market was swiftly rejected by this level and rebounded.
We can see that on July 13, 2018, the day Coinbase announced that it was ‘exploring’ adding XLM to its platform, the market began its bullish run with a 15% price increase in 1 day. The market continued to surge after this announcement, pushing price action above the 100-day moving average to where it is currently trading, at support, located at the short-term .5 Fibonacci Retracement priced at $0.32. We can see that the market hit resistance at the short-term .382 Fibonacci Retracement priced at $0.35 before rolling over.
If the bullish momentum can continue and push price action above the $0.35 handle, we expect immediate resistance to be located at the 1.272 Fibonacci Extension priced at $0.3741. Further resistance above this level is located at the long-term .618 Fibonacci Retracement (drawn in black) priced at $0.3914. This area would require significant momentum to overcome due to the confluence of the 1.414 Fibonacci Extension (not drawn on the chart) being located in the same area.
Alternatively, if the bears step back into the market once again, we expect near-term support to be located at the short term .618 Fibonacci Retracement priced at $0.28 followed by the 100-day moving average which is currently hovering around the $0.27 level, at this moment in time. Significant support below this level is located at the .786 Fibonacci Retracement priced at $0.23. This area contains both the short-term and long-term .786 Fibonacci Retracements, further adding to the level of support expected here.
The technical indicators are strongly favoring the bulls at this moment in time. The RSI is currently trading well above the 50 handle indicating the strong bullish momentum within the market. Similarly, the moving averages are all trading in an extreme bullish manner indicating that the bullish pressure is, currently, totally in control.
Let us continue to quickly analyze XLM relative to BTC over the long term.
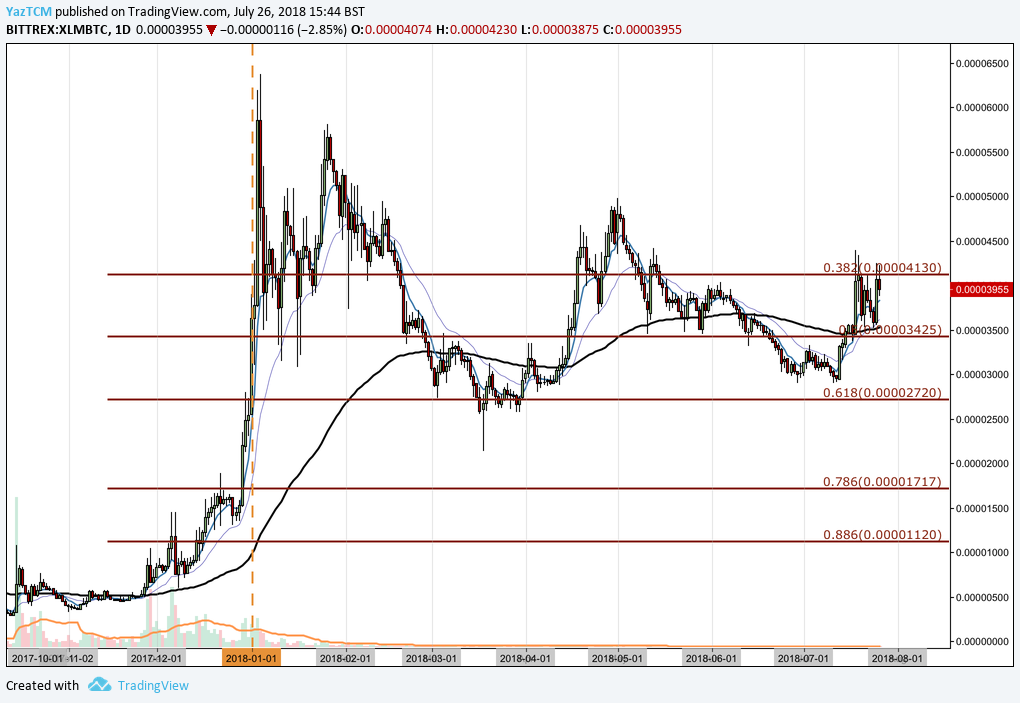
XLM/BTC – LONG TERM – DAILY CHART
https://www.tradingview.com/x/mbwMbtM8/
Analyzing the market relative to Bitcoin, over the long period, we can see that XLM had experienced a significant price increase toward the end of 2017 when price action started from a low of 327 SATS on November 2, 2017 and surged to an all-time high of 6,370 SATS on January 4, 2018. This was a price increase from low to high totalling over 1,730%.
The market went on to fall throughout early 2018, until it found support at the .618 Fibonacci Retracement priced at 2,720 SATS. This is a Fibonacci Retracement measured from the bullish run aforementioned. This price level provided significant support and the market continued to rise from here.
Over the course of July, we can see that, unlike the majority of altcoins in this period, XLM has managed to remain relatively strong compared to BTC. We can see that price action is above the 100-day moving average and is currently trading at resistance located at the .382 Fibonacci Retracement at 4,130 SATS.
If the bears step back into the market, we expect near-term support to be immediately located at the 100-day moving average which is currently floating around 3,600 SATS, followed by the .5 Fibonacci Retracement priced at 3,425 SATS.
Alternatively, if the bulls can keep the momentum going, we expect near-term resistance to be located at May 2018’s price high located at 4,980 SATS.
Related: A Look at the Stellar (XLM) 2018 Roadmap