
The cryptocurrency Steem has experienced a small price decline totaling 2.24% over the past 24 hours of trading. Steem is currently trading hands at a price of $1.40, and has seen a small price hike of 0.9% over the past 7 trading days.
Steem was launched in 2016 by co-founders Ned Scott and Daniel Larimer. Daniel Larimer is an experienced crypto developer founding projects such as BitShares, Steem and most recently, EOS.
The Steem platform sets out to become a blockchain-based social media network which allows content creators and social media participates to be rewarded. The Steemit platform is where all the magic happens. Content creators create their content and post it to the Steemit platform for other users to come and view. Users can then choose to like, share and upvote content as well as providing small donations to their favorite content creators.
The fascinating thing about Steemit is that it is fully decentralized. It doesn’t run like reddit does on a central server. Instead, it is run on the blockchain, and is so fluid that you would not be able to tell it was blockchain-based unless you were told.
The platform has received an overwhelming volume of support with a large number of content creators contributing daily. For more information on Steem and Steemit, please refer to our “What is Steem” guide and review of Steemit.
The 27-month old coin is currently ranked 36th in terms of overall market cap across the entire industry. The cryptocurrency currently has a market cap totaling $372 million. It has significant losses to regain as the cryptocurrency has fallen 17.51% over the past 30 trading days and 64% over the past 90 trading days.
Let us continue to analyze price action for Steem over the long term.
Price Analysis
STEEM/USD – LONG TERM – MONTHLY CHART
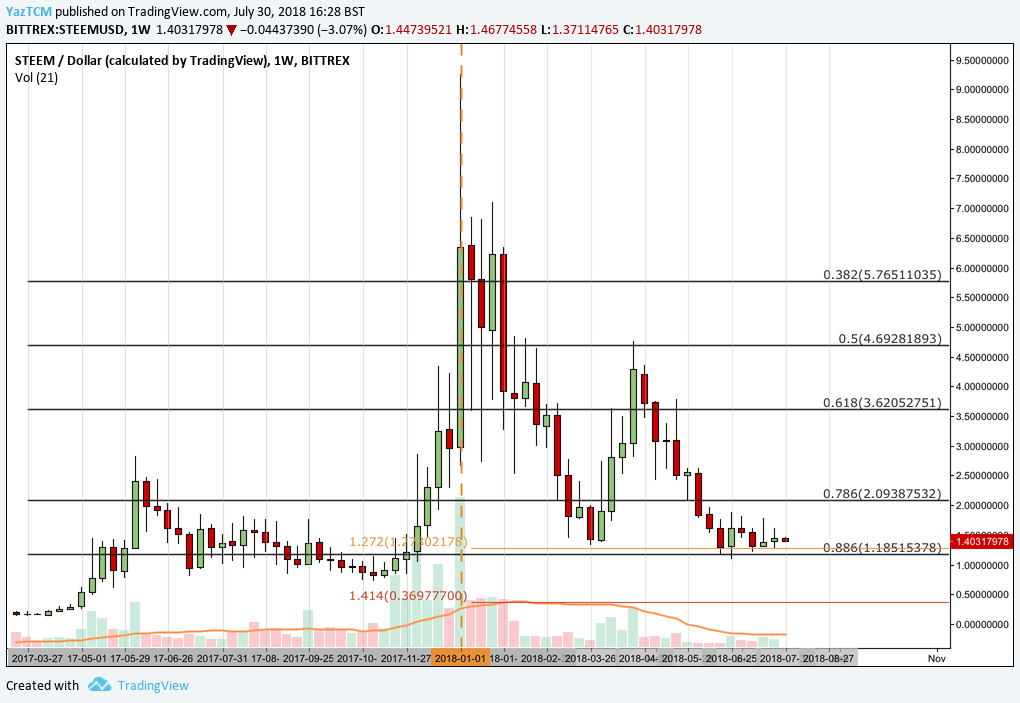
Analyzing the super long-term monthly chart above, where each bar represents a period of 1 month, we can see that the cryptocurrency had experienced an incredibly long bullish run, separated in two waves,throughout 2017 when price action started from a low of $0.15 on April 2, 2017 and rose to an all-time high of $9.25 on January 3, 2018. This was an unprecedented price increase totaling 3,700% from low to high.
We can see that the market began to roll over after posting the all-time high. Price action had briefly found support at the .618 Fibonacci Retracement priced at $3.62. This is a retracement measured from the entire bullish run aforementioned.
Price action failed to hold above this level and continued to fall until it found support at where it is currently trading, at the .886 Fibonacci Retracement priced at $1.18. We can see that this area of support is bolstered by a downside 1.272 Fibonacci Extension priced at $1.27. This downside Fibonacci Extension is measured from the entire bearish swing seen during January 2018.
Let us continue to analyze price action over the more recent period to highlight any potential support and resistance areas.
STEEM/USD – MEDIUM TERM – DAILY CHART
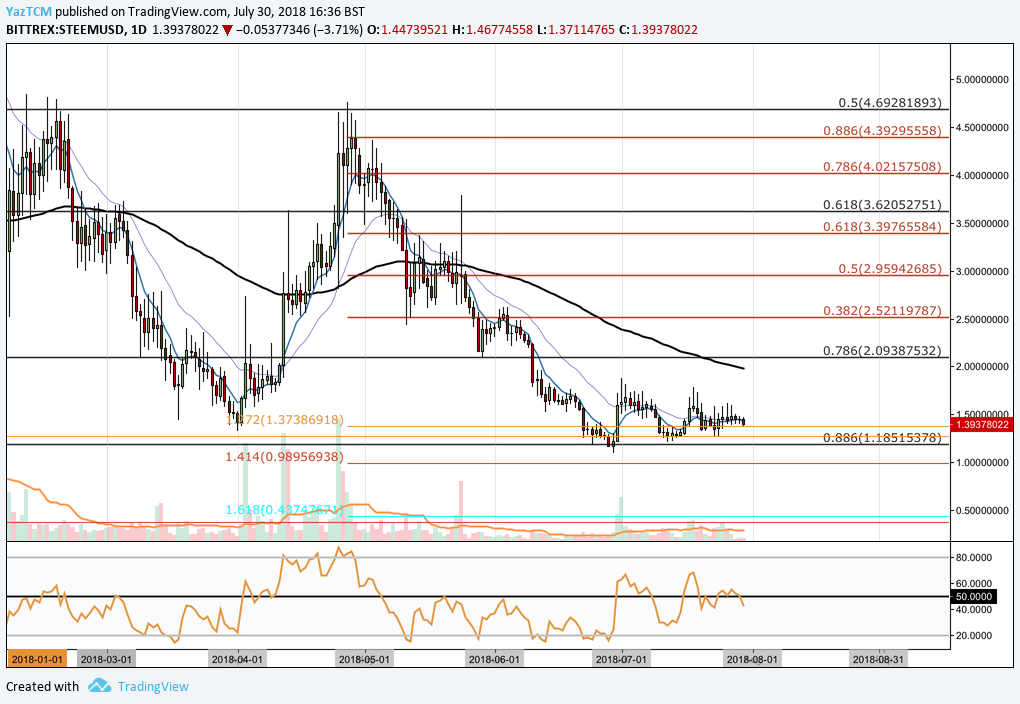
Analyzing the market from the medium perspective above, we can see that price action had experienced a smaller bullish run during April 2018 when price action started from a low of $1.32 on April 1, 2018 and extended to a high of $4.76 on April 27, 2018. This was a price increase totaling 250% from low to high.
The market went on to decline during May, falling below the 100-day moving average until it found support at the long-term .786 Fibonacci Retracement priced at $2.09. However, the market was not able to hold this level and continued to fall during June until finding support at the .886 Fibonacci Retracement priced at $1.18. This area of support is further bolstered by a short-term downside 1.272 Fibonacci Extension priced at $1.37.
If the bearish trajectory witnessed over the past year continues, we expect significant support to be located at the .886 Fibonacci Retracement priced at $1.18 once again. If the bearish pressure can push the market below this level, we expect immediate support to be located at the medium-term downside 1.414 Fibonacci Extension priced at $0.98, followed by the downside 1.618 Fibonacci Extension priced at $0.43.
Alternatively, if the bullish momentum can increase in the market, we expect immediate resistance to be located at the monthly highs located around $1.80. Resistance above this level is expected at the long-term .786 Fibonacci Retracement priced at $2.09. It is important to mention that this area of resistance will require significant momentum due to the 100-day moving average being located close to the area, which is currently hovering around the $2 handle.
The RSI indicator is currently reading slightly bearish sentiment trading just below the 50 handle. If we are to expect the bullish momentum to re-enter the market, we will need to see the RSI breaking above the 50 handle and continue to slowly rise.
Let us continue to analyze price action relative to Bitcoin over the long term.
STEEM/BTC – LONG TERM – MONTHLY CHART
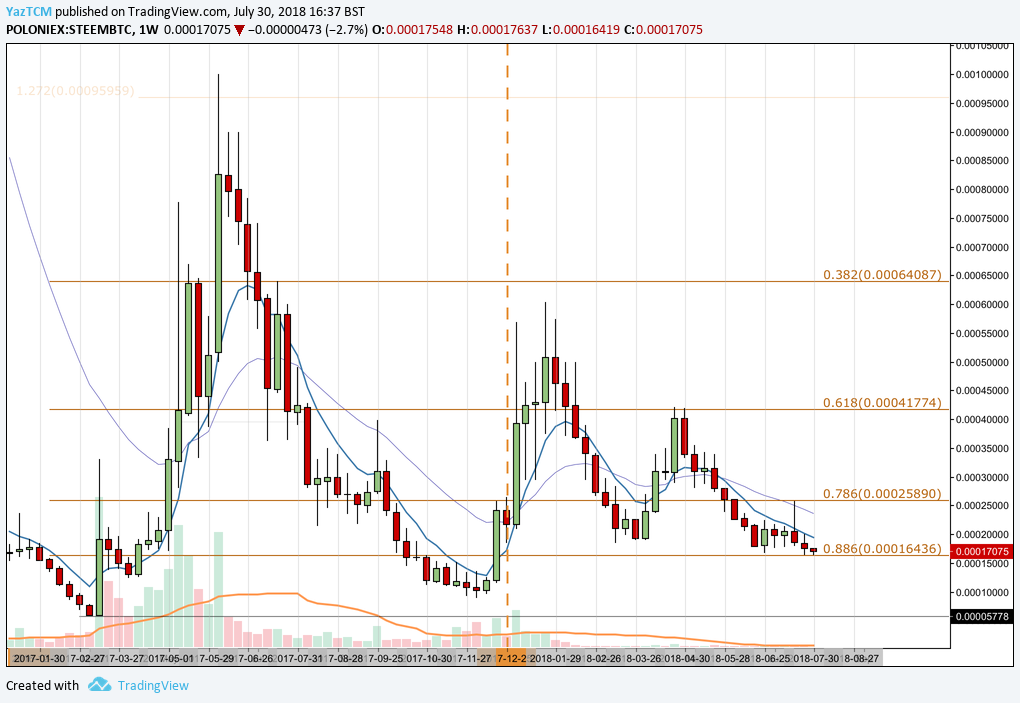
Analyzing the market relative to Bitcoin over the long term, we can see that 2017 was an incredibly bullish year as price action started from a low of 8,825 SATS on March 13, 2017 and extended to an all-time high of 99,998 SATS on June 9, 2017. This was a 1,500% price increase from low to high.
The market went on to fall for the second half of 2017 until finding the bottom of the trend in December 2017. We can see that price action went on to make another bullish run before falling again.
The market is currently trading at support at the long-term .886 Fibonacci Retracement priced at 16,436 SATS. This Fibonacci Retracement is measured from the entire bullish run outline above.
Let us continue to analyze the market further over the more recent period to highlight potential support and resistance areas.
STEEM/BTC – LONG TERM – DAILY CHART
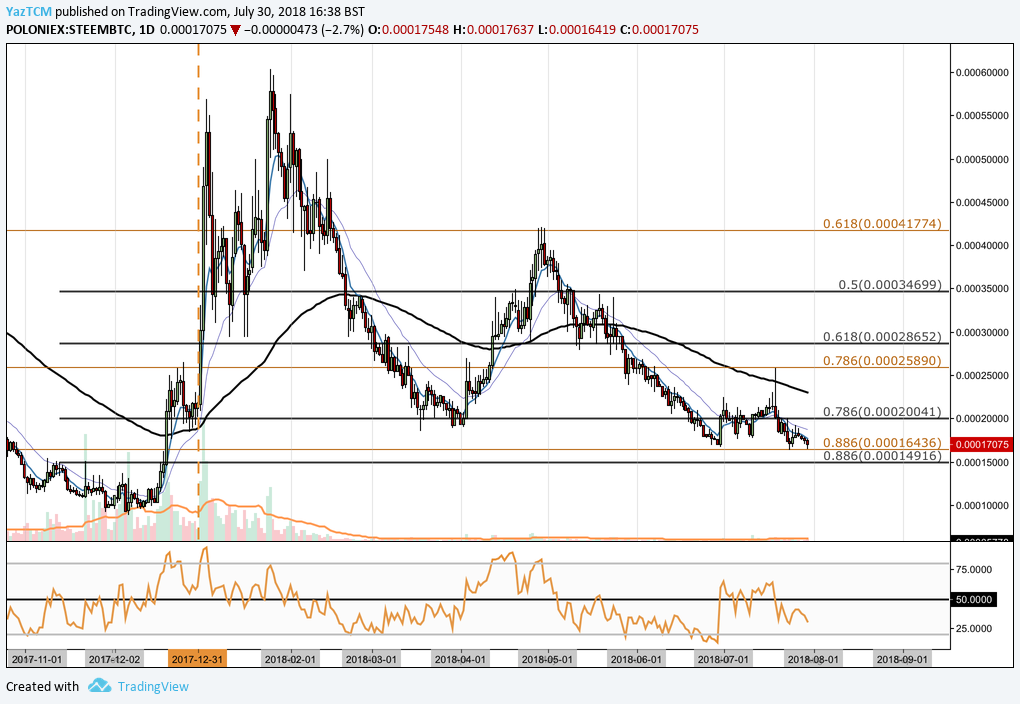
Analyzing the market over a shorter time period, we can see that the STEEM had another bullish run when price action started from a low of 8,825 SATS on December 7, 2017 and rose to a high of 60,359 SATS on January 25, 2018. This was a price increase totaling 610%.
The market went on to fall after placing the all-time high, falling through the 100-day moving average during February until finding support at the short term .786 Fibonacci Retracement priced at 20,041 SATS (drawn in black). This short term Fibonacci Retracement is measured from the entire 610% price increase outlined above.
The market went on to make another smaller bullish run during April, like the rest of the cryptocurrency market, but rolled over during May and June until it found support where it is currently trading at the long term .886 Fibonacci Retracement (drawn in gold) priced at 16,436 SATS.
If the bearish pressure continues within the market, we expect immediate support to be located at the shorter-term .886 Fibonacci Retracement (drawn in black) priced at 14,916 SATS. If the market does make it this low, it would create a new trading low for the 2018 trading year so far.
Alternatively, if the bulls can step back into the market, we expect immediate resistance to be located at the 100-day moving average, which is currently hovering around the 23,000 SATS handle, followed by the long-term .786 Fibonacci Retracement priced at 25,890 SATS.
Related: Blockchain Projects That Are Leading the Web 3.0 Evolution