
- Siacoin is struggling to overcome the 100-day moving average both against the USD and BTC.
- The RSI has slipped under 50, indicating the more expected downward pressure to come.
- Support moving forward: $0.6610, $0.006114, $0.005618, $0.004912, $0.004621, $0.004012.
- Resistance moving forward: $0.007760, $0.008216, $0.009025, $0.009332, $0.009929, $0.01078.
Siacoin has seen a decline in price totaling 4.91% over the past 24 hour trading period as the entire industry sees another bloody day across the board. The SC coin is now exchanging hands at a price around $0.0067, after seeing a small 7-day price decline totaling only 1.68%.
The Sia project is ranked 33rd in terms of overall market cap with a total market cap value of $253 million. Sia has seen an 11% price increase over the past 30 trading days, indicating that the market may be preparing for a reversal in the overall downtrend. The 38-month old coin is now trading at a value that is 93% lower than its all-time high price.
Let us continue to analyze Sia over the long term and assess the market behavior.
Siacoin Price Analysis
SC/USD – LONG TERM – DAILY CHART
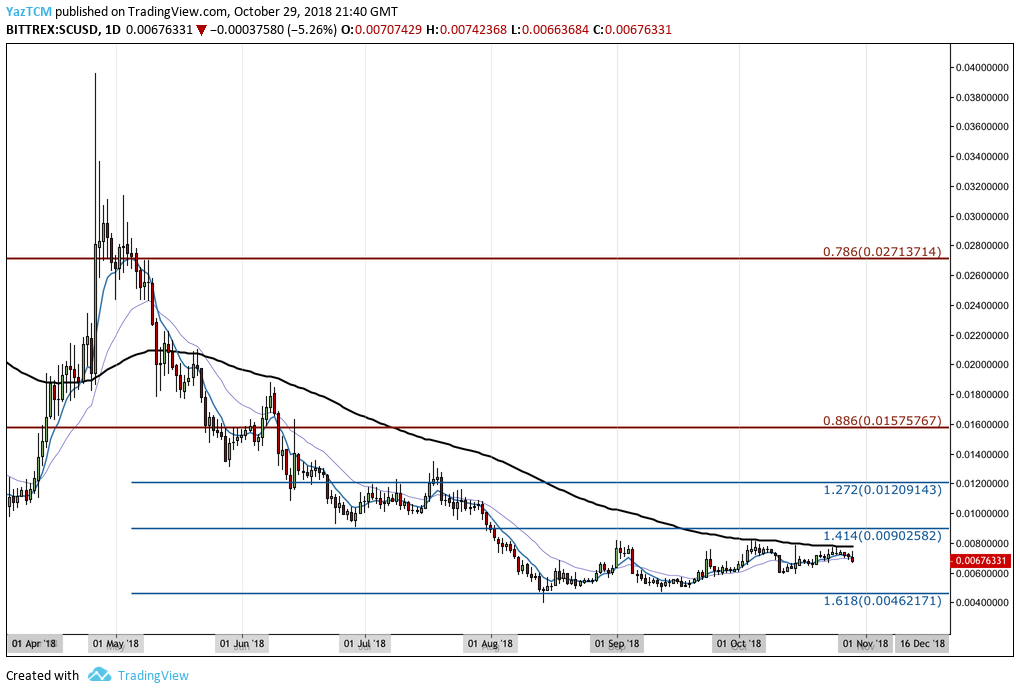
Looking at an overview of the SC/USD market from the long-term perspective, we can see that since having a price rally in April 2018, the market has continued to decline month-on-month. The decline continued until further support was found during August 2018, as the market reached a downside 1.618 Fibonacci Extension level priced at $0.004621.
At this level of support, the bulls within the market began to protect the market from breaking below and eventually managed to reverse the downtrend. This resulted in a small price rebound.
Let us continue to analyze price action a little closer over the short term and continue to highlight any potential areas of support and resistance.
SC/USD – SHORT TERM – DAILY CHART
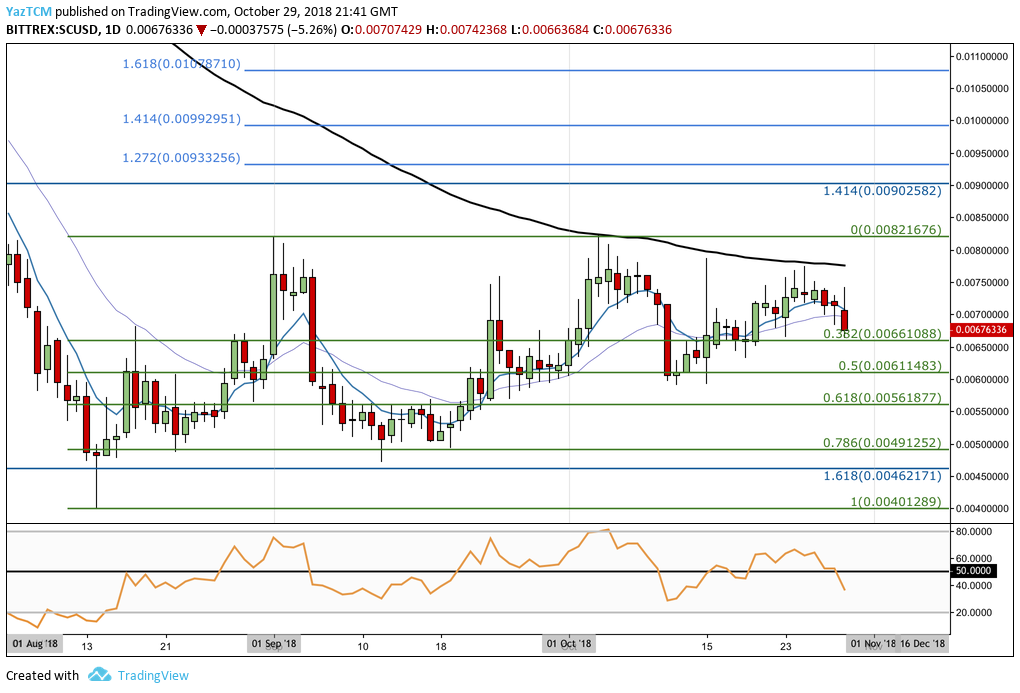
Analysing Sia against the USD from a closer time horizon, we can see the price rally during August 2018. SC/USD began at a low of $0.0039 on August 14, 2018 and rose to a high of $0.008214 on September 1, 2018. This was a price increase totaling over 100% from low to high.
The SC/USD market has remained within this bullish swing leg’s trading range over the past 2 months. Price action still has not managed to break above the September 1, 2018 price high.
We can see that SC/USD had found support at the short-term .786 Fibonacci Retracement level (drawn in green) priced at $0.004912 during September 2018 before rebounding once again. The SC/USD market went on to make a re-test at the September 2018 high during October 2018, but had met resistance at the 100-day moving average. This caused price action to roll over once again.
The market is now approaching support at the short-term .382 Fibonacci Retracement level priced at $0.006610. If the bears continue to pressure the price action below the $0.0066 handle, further support below can be expected at the .5 and .618 Fibonacci Retracement levels, priced at 40.006611 and $0.005618 respectively.
If price action continues even further lower, then more support beneath will be located at the short-term .787 Fibonacci Retracement level priced at $0.004912, followed by the long-term downside 1.618 Fibonacci Extension level (drawn in blue) priced at $0.004621.
On the other hand, if the bulls within the market can regroup their efforts at the support provided by the short-term .382 Fibonacci Retracement level and push the market higher, they will immediately encounter resistance above. This resistance is located at the 100-day moving average level which currently hovers around the $0.007760 handle.
SC/USD has not managed to break and close above the 100-day moving average since April 2018 so significant momentum will be required to overcome this resistance.
If the bulls can power further higher above the 100-day moving average, further resistance above will be located at the September 1, 2018 high priced at $0.008214. Resistance above this can then be expected at the 1.272 and 1.414 Fibonacci Extension levels (drawn in light blue), priced at $0.0093 and $0.009929.
The RSI has recently slipped below the 50 handle to indicate that the bears are in control of the market momentum. This could show that the market is preparing to head further lower before any recovery can be made.
Let us continue to analyze price action relative to BTC over the long term and assess the market dynamics.
SC/BTC – LONG TERM – DAILY CHART
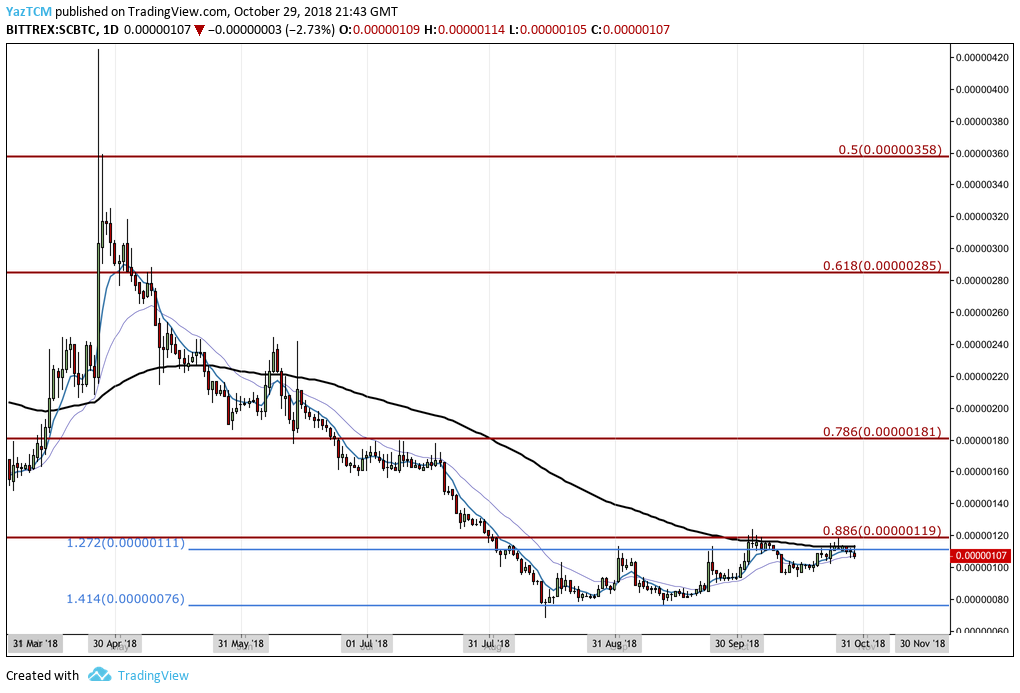
Inspecting SC/BTC from the long term outlook above, we can see that this market had also found support, after months of downward price action, at a long-term downside 1.414 Fibonacci Extension level priced at 76 SATS.
As price action reached this level, the bulls re-entered the battle, causing the downtrend to stall and reverse.
Let us quickly continue to analyze price action from a closer time horizon and highlight any potential support and resistance levels moving forward.
SC/BTC – SHORT TERM – DAILY CHART
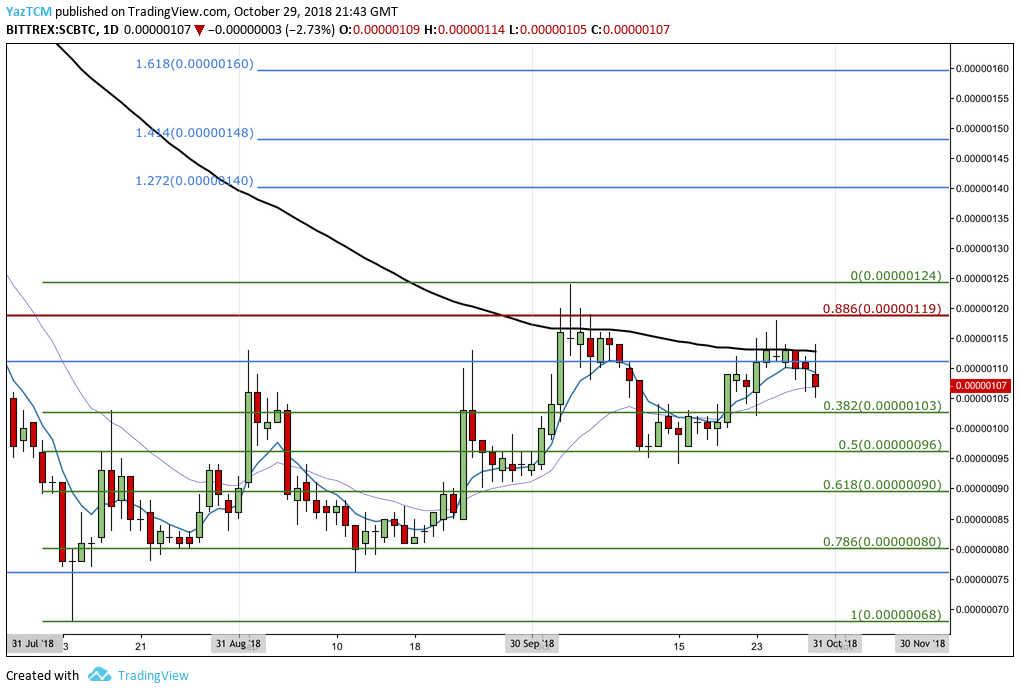
Assessing SC/BTC from the short-term horizon above, we can see that the market had also met resistance at the 100-day moving average during October 2018. Price action was not able to overcome this level after testing the moving average twice during October 2018.
The market is now retreating and heading further lower. If the bears manage to pressure the market lower, they will meet immediate support at the .382 Fibonacci Retracement level priced at 103 SATS. If the bears can penetrate the market below the 100 SATS handle, then further support below can be located at the short0term .5 and .618 FIbonacci Retracement Levels, priced at 96 SATS and 90 SATS respectively.
In the scenario that the bears continue to head even further lower, more support below is expected at the .786 Fibonacci Retracement level priced at 80 SATS, followed by the long-term downside 1.414 Fibonacci Extension level priced at 76 SATS.
Alternatively, if the bulls can shake off the recent downturn and push SC/BTC higher, the nearest level of significant resistance above will be located at the 100-day moving average. If the bulls can push their way above the 100-day moving average, more resistance above will be located at the long-term .886 Fibonacci Retracement level (drawn in red) priced at 119 SATS, followed by the October 2018 high at 124 SATS.
If the bulls continue above 124 SATS, more expected resistance above can be located at the 1.272 and 1.414 FIbonacci Extension levels, priced at 140 SATS and 148 SATS.