
- QASH has been trading in 3-month long range between $0.20 and $0.24.
- QASH is making gains against BTC as price action battles with resistance at the 4,000 SATS handle.
- Support moving forward: $0.2045, $0.1872, $0.1627, $0.1507, $0.14.
- Resistance moving forward: $0.2218, $0.2431, $0.2507, $0.2777, $0.30, $0.3172, $0.3202, $0.33788, $0.3675.
QASH has remained relatively calm against the USD over the past 24 hours of trading where price action has seen a small 0.3% increase. The cryptocurrency is presently trading around $0.2148, at the time of writing, and has seen a 3.16% decrease in price against the USD over the past 7 days.
However, despite the overall market turbulence, QASH has been on a recent tear against Bitcoin over the past few days. It rose from a low of 3,152 SATS on November 12 to a high of 4,027 SATS on November 16. This was a 27% increase in price against Bitcoin on one of the most volatile 4-day periods for Bitcoin in 2018.
The QASH project is now ranked in the 69th position in terms of overall market cap, with a total market cap value of $75 million. QASH has seen a 27% price increase against the USD over the past 90 trading days as the 12-month old cryptocurrency trades at a value that is 91% lower than the all-time high price.
Let us continue to analyze price action for QSH/USD over the past few months and highlight any areas of potential support and resistance.
QASH Price Analysis
QASH/USD – SHORT TERM – DAILY CHART
For a long term overview of QSH/USD, we recommend a quick look at our previous QASH analysis.
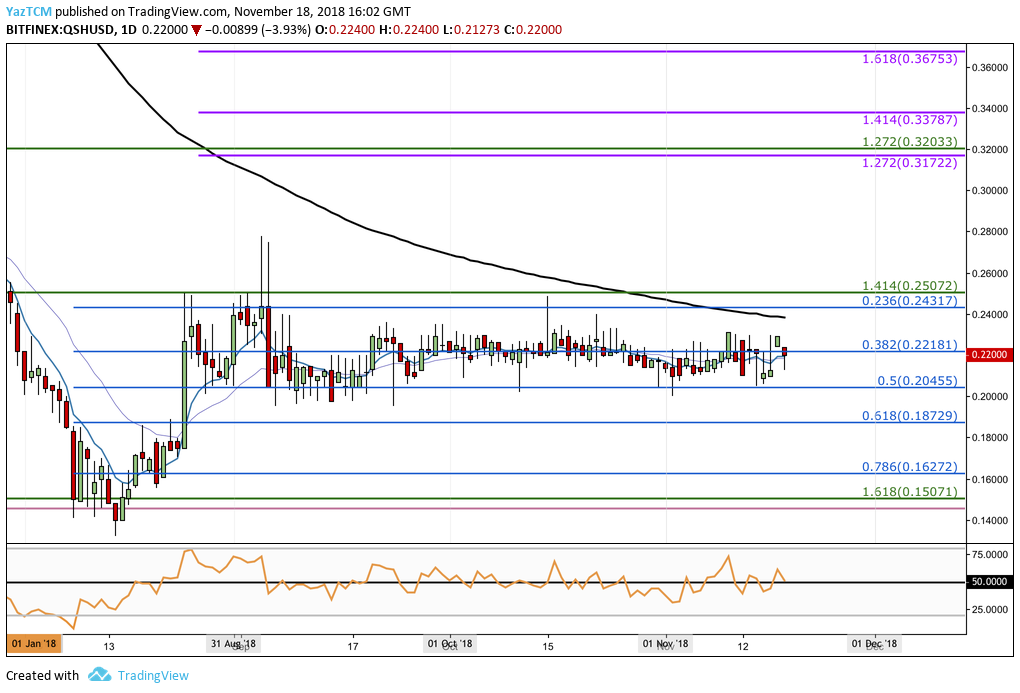
From the short-term perspective above, we can immediately see the price surge for QASH/USD. It started at a low of $0.1322 on August 14, 2018 and extended to a high of $0.2777 on September 4, 2018, creating a price hike totaling over 112%.
QASH/USD has since pulled back from this high to find support at the short-term .5 Fibonacci Retracement level (drawn in blue) priced at $0.20455, during September 2018.
The market has remained remarkably stable over the following 2 months after hitting this support as price action has remained trapped within a narrow trading range priced between $0.20 as the lower boundary and $0.24 as the upper boundary.
Moving forward, if the bearish sentiment increases within the market and pushes price action lower for QASH/USD, we can expect immediate support to be located at the lower boundary of the trading range at $0.20. If the sellers can continue to push price action below the range, we can expect further support beneath to be located at the .618 and .786 Fibonacci Retracement levels (drawn in blue), priced at $0.1872 and $0.1627 respectively.
If the sellers persist and push price action further lower, more support underneath the $0.16 handle can be located at the long-term downside 1.618 Fibonacci Extension level (drawn in green) priced at $0.1507, followed by the August 2018 low at $0.1322.
Alternatively, in our bullish scenario, if the buyers can regather their momentum and push price action back above the $0.22 handle, we can expect immediate resistance above to be located at the upper boundary of the range and the psychological round number resistance at $0.24.
This resistance is further bolstered by the 100-day moving average which is floating in the same price area.
If the buyers can continue to drive price action higher and clear the September 2018 high at $0.2777, we can expect further higher resistance to then be located at the $0.30 handle, followed by the short-term 1.272 Fibonacci Extension level (drawn in purple) priced at $0.3172.
Higher resistance above $0.32 can be expected at the 1.414 and 1.618 Fibonacci Extension levels (drawn in purple), priced at $0.3378 and $0.3675 respectively.
The RSI is currently trading at the 50 handle, indicating the indecision within the market. If the RSI drops below 50, we could see QASH/USD heading back toward the lower boundary of the range at around $0.20.
Let us continue to analyze QASH against Bitcoin over the short term and highlight some potential areas of support and resistance moving forward.
QASH/BTC – SHORT TERM – DAILY CHART
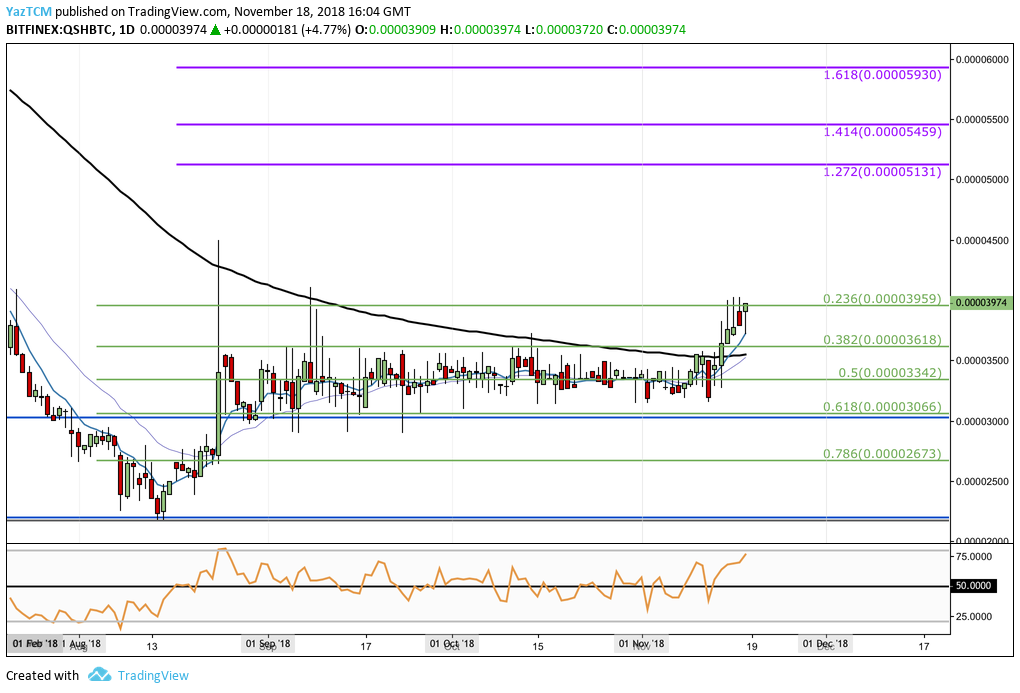
Examining the market from the short-term perspective above, we can see that after QASH/BTC rebounded from the long-term downside 1.414 Fibonacci Extension level (drawn in blue) priced at 2,198 SATS during August 2018, the market went on to surge to create a price increase totaling 105% as QSH/BTC reached the 4,499 SATS handle on August 24, 2018.
The market had rolled over at the high to then find support at the short-term .618 Fibonacci Retracement level (drawn in green) priced at 3,066 SATS during September 2018.
This level of support continued to hold until the market surged again in November 2018 to where it is currently trading at resistance provided by the .236 Fibonacci Retracement level (drawn in green) priced at 3,959 SATS.
Moving forward, if the bulls can continue with their aggression and push price action above the 4,000 SATS handle, we can expect immediate resistance higher to be located at the August 2018 high priced at 4,499 SATS. If the buyers can continue to climb above 4,499 SATS, we can then expect higher resistance to be located at the 1.272 and 1.414 Fibonacci Extension levels (drawn in purple) priced at 5,131 SATS and 5,459 SATS respectively.
The final level of resistance above to highlight is located at the 1.618 Fibonacci Extension level (drawn in purple) priced at 5,930 SATS.
On the other hand, in our bearish outline, if the buyers fail to break above 4,000 SATS and price action starts to decrease, we can expect immediate support below to be located at the .382 and .5 Fibonacci Retracement levels (drawn in green), priced at 3,618 SATS and 3,342 SATS respectively.
If the sellers continue to push price action lower, then more support can be expected at the .618 Fibonacci Retracement level priced at 3,066 SATS.
If the bears manage to then penetrate below the 3,000 SATS handle, we can expect lower support to be located at the .786 Fibonacci Retracement level (drawn in green) priced at 2,673 SATS, followed by the August 2018 low priced at 2,173 SATS.
The RSI is indicating that the bulls are in possession of the market momentum as it trades above the 50 handle. If the RSI can remain above 50, we can continue to see this market to climb higher.