
Populous has seen a small 3.83% price decrease over the past 24 hours of trading. The cryptocurrency is currently exchanging hands at a price of $3.12 after seeing a 6.25% price decline over the past 7 trading days.
Populous is a P2P platform dedicated towards invoice financing. It aims to help small and medium-sized enterprises (SMEs) with some temporary financial relief during their invoice periods. It is essentially a payday loan for businesses.
The platform itself creates an exchange for buyers and sellers of invoices. The beta was launched in May 2018 and it utilizes blockchain technology, XBRL Data and Altman Z-Score to create an in-house credit rating system which allows the platform to determine the likelihood that a borrower will default on his terms.
Populous is trying to disrupt the $3 trillion invoice financing industry. The cryptocurrency is currently ranked 56th in terms of overall market cap across the entire industry. It has a total market cap value of $115 million after the 14-month old coin suffered a 44% price decrease over the past 90 trading days.
Populous is currently trading at a value that is 95% lower than its all-time high price.
Let us continue to analyze price action for Populous over the long term.
Populous Price Analysis
PPT/USD – LONG TERM – DAILY CHART
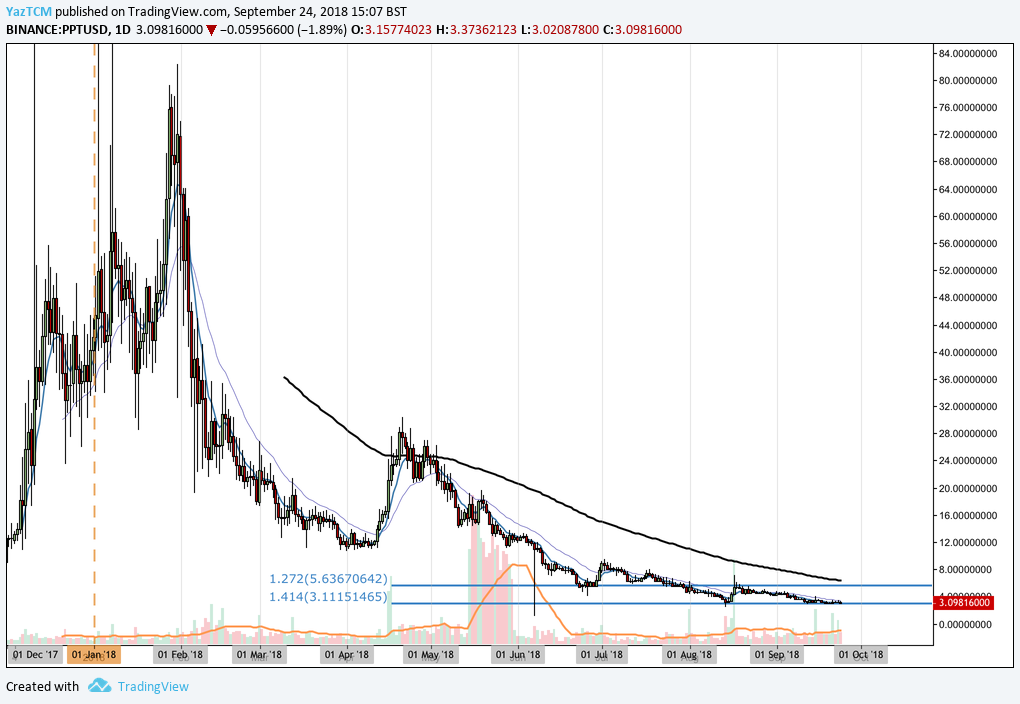
Analyzing the market from the long-term perspective above, we can see that price action had experienced a significant bullish run as he market started from a low of $11.20 on December 2, 2017 and extended to a high of $123.43 on January 3, 2018. This was a price increase totaling over 1,000% from low to high.
We can see that after the market placed the high, price action rolled over and fell significantly. It continued to fall throughout the majority of the trading year, and has remained underneath the 100-day moving average for the entire year. It has recently found some level of support at a downside 1.414 Fibonacci Extension level priced at $3.11.
Let us continue to analyze price action a little closer over the shorter term to highlight any potential support and resistance areas.
PPT/USD – SHORT TERM – DAILY CHART
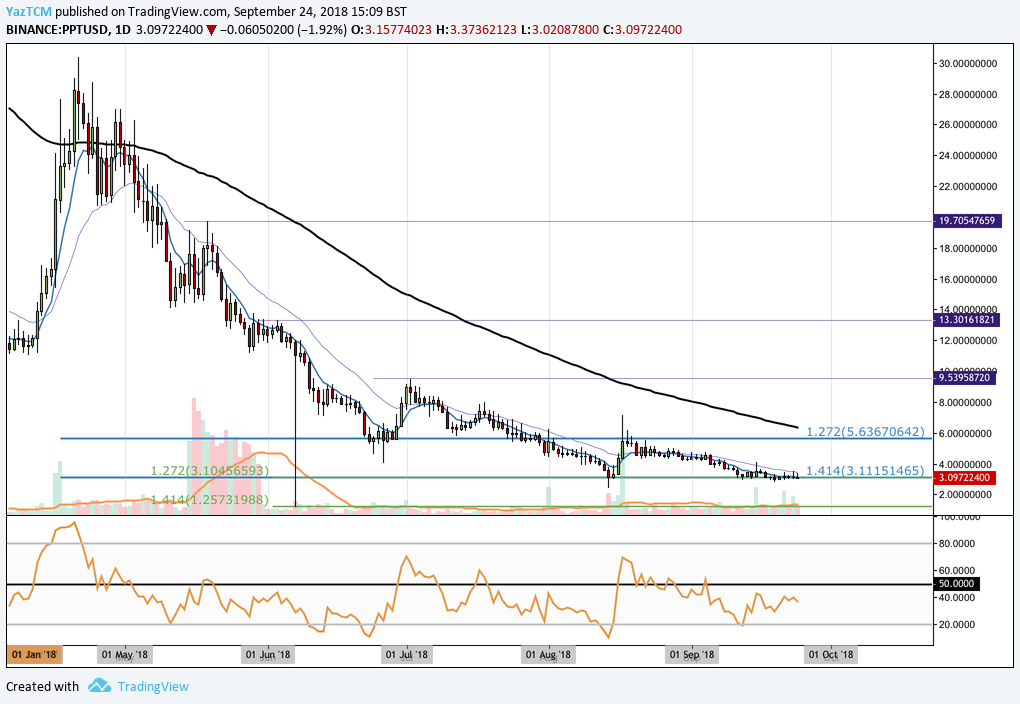
Analyzing the market from the short-term perspective above, we can see that the recently found support at the long-term downside 1.414 Fibonacci Extension level (drawn in blue) priced at $3.11 was significantly bolstered by another shorter-term downside 1.227 Fibonacci Extension level priced at $3.10.
This area of combined support has supported the market for over 2 months now as price action has not yet managed to penetrate below this level.
We can also see that, for the past 2 trading months, price action has now established a strong trading range bound between the long-term downside 1.272 Fibonacci Extension (drawn in blue) level priced at $5.63 as the upper boundary of the trading range and the long-term downside 1.414 Fibonacci Extension level (drawn in blue) priced at $3.11 as the lower boundary of the trading range.
Moving forward, if the bulls can regather momentum from this level of support and continue to push price action higher, we expect immediate resistance to be located at the upper boundary of the trading range priced at $5.63. We can see that this price area had provided significant support for the market during June and July 2018. Therefore it is expected to provide significant resistance moving forward.
If the bulls can push price action above the upper boundary of the trading range, further resistance higher will be located at the 100-day moving average level which currently is hovering around the $6 handle. The market will require significant momentum to overcome this level as price action has not penetrated above the 100-day moving average all through the trading year.
Further expected resistance above the 100-day moving average can then be expected at the July 2018 market high priced at $9.53, followed by the June 2018 market high priced at $13.30.
Alternatively, if the bears manage to push price action below the support located at the lower boundary of the trading range priced at $3.11, we expect immediate support located below to be at the psychological round number handles of $3, $2.50 and $2.00.
If the market continues even lower, then further support below can be expected at the short-term downside 1.414 Fibonacci Extension level (drawn in green) priced at $1.25.
The technical indicators within this market are largely favoring the bears at this moment in time. The RSI is currently trading well below the 50 handle, indicating that the bears are in control of the momentum within the market. If the RSI can makes it way above the 50 handle, we can expect the market to make some gains.
Let us continue to quickly analyze price action for PPT relative to BTC over the short term and highlight any potential support and resistance level.
PPT/BTC – SHORT TERM – DAILY CHART
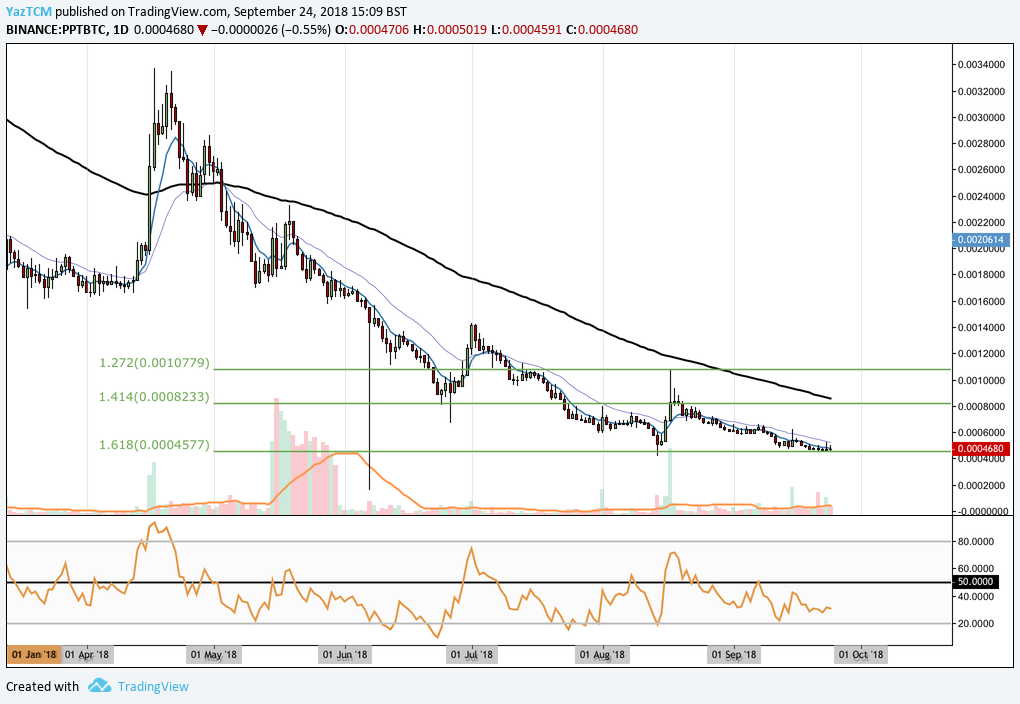
Analyzing the market from the short-term perspective above, we can see that price action has been gradually falling over the past few months. It had originally found some form of support at a downside 1.414 Fibonacci Extension level priced at 8,233 SATS during June 2018 but price action continued further lower during July 2018.
We can see that price action continued to fall until recently finding support at a short-term downside 1.618 FIbonacci Extension level priced at 4,577 SATS. As price action approached this level, the market was supported and began to trade sideways.
We can see that the market has now been bound between a range with the 8,233 SATS handle as the upper boundary and the 4,577 SATS handle as the lower boundary of the range.
To break above the upper boundary of the range, the price action will require significant momentum to overcome due to the 100-day moving average further bolstering the expected resistance within this area. If the bulls can push price action higher above the upper boundary, then further resistance can be expected at the downside 1.272 FIbonacci Extension level priced at 10,779 SATS.
Alternatively, if the bears push price action below the lower boundary, we can expect further support to be located at the psychological round number handle of 4,000 SATS.