
PIVX has seen a 3.78% price increase over the past 24 hours of trading. The cryptocurrency is currently trading at $1.25 per token after seeing a further 1.97% price increase over the past 7 trading days.
PIVX is a cryptocurrency dedicated to upholding privacy for its users. PIVX stands for Private Instant Verified Transactions. It is a Proof-of-Stake cryptocurrency that was forked from Dash in January 2016, and can boast instant transactions that are both faster and cheaper.
PIVX runs on community governance which allows coin holders to have a say on network proposals. The network is governed by master nodes who maintain the network and receive a reward for their efforts. To own a Masternode, a user must lock away 10,000 PIVX tokens to be staked within the network.
For more information on masternodes we recommend you check out our article “5 Masternodes Coins For Earning Passive Income.”
PIVX is currently ranked 98t according to CoinMarketCap, in terms of overall market cap across the entire industry. The 31-month old coin has a total market cap value of $70 million after suffering a declining price this year.
Let us continue to analyze PIVX over the long term to gauge an outlook on the market.
PIVX Price Analysis
PIVX/USD – LONG TERM – DAILY CHART
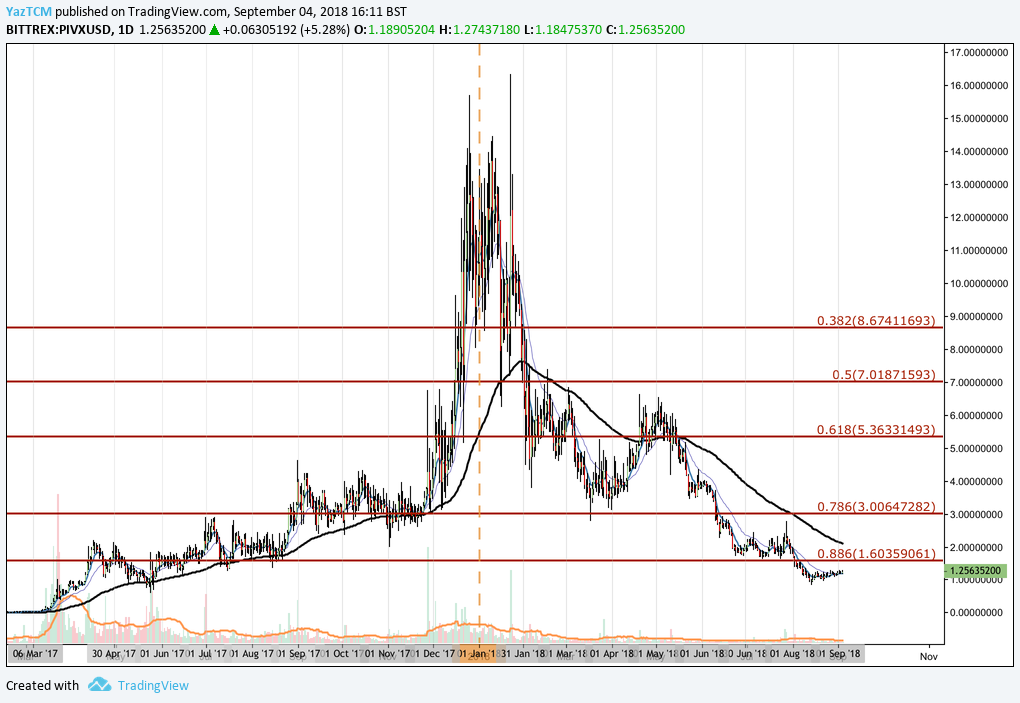
Analyzing the market from the long-term perspective above, we can see that price action had experienced an incredible bullish run throughout 2017, rising from a low around $0.011 in February 2017 to a high of $15.69 on December 26 2017. This was over a 9,000% increase in price from low to high.
After price action placed the all-time high, we can see that the market rolled over and started to decline rapidly. It had originally found support around the .618 Fibonacci Retracement level priced at $5.36 in February 2018 and proceeded to rally, but failed to break back above the 100-day moving average and continued further lower.
After finding support at the .786 FIbonacci Retracement priced at $3.00 in March 2018, the market experienced a small bullish rebound. However, price action was not able to maintain itself over the 100-day moving average for very long and continued to fall below once again during May 2018.
We can see that the support at the .886 Fibonacci Retracement level held throughout July 2018. But as August started to trade, we can see that price action penetrated below and fell to as low as under $1 for a brief time.
Let us continue to analyze price action a little closer over the short term to highlight any potential support and resistance areas.
PIVX/USD – SHORT TERM – DAILY CHART
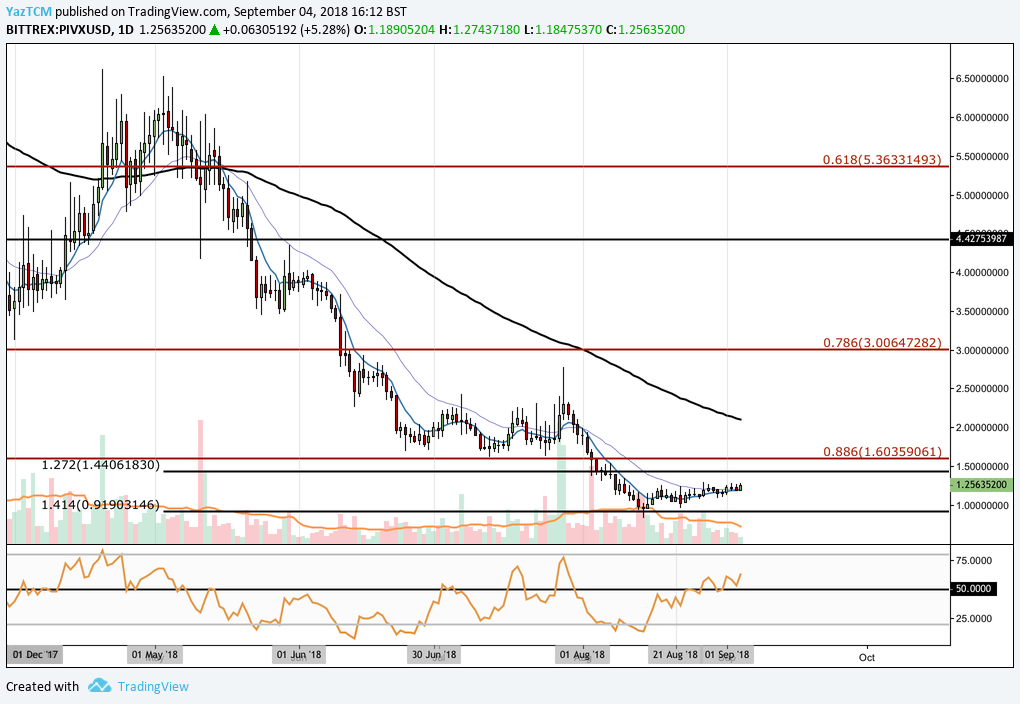
Analyzing the market at a closer time horizon, we can see that after price action broke below the support at the long-term .886 Fibonacci Retracement, it continued to fall until finding support identified by a short-term downside 1.414 Fibonacci Extension level priced at $0.91.
We can see that the market has been trapped within a range-bound trading condition between the short-term downside 1.272 and 1.414 Fibonacci Extension levels, priced at $1.44 and $0.91 respectively.
The recent narrow range-bound condition could be a signal that the aggressive downtrend the market has experienced over the past few months has started to show some signs of fading.
If the recently-experienced bullish momentum can continue to push price action back above the upper boundary of the range at $1.44, then we can expect immediate resistance around the long-term .886 Fibonacci Retracement level priced at $1.60. This price level has provided previous support in the past, so the market will require significant volume and and momentum to overcome this level.
Further resistance above this level can then be expected at the 100-day moving average which is currently hovering around the $2.09 handle, followed by the .786 Fibonacci Retracement level priced at $3.00.
Alternatively, if the bears regroup and begin to push price action downward, we can expect the lower boundary of the range priced at $0.91 to provide significant support. If price action continues further below, we can expect support at the psychological round number handles of $0.85 and $0.80.
The technical indicators within the market are beginning to show favor toward the bulls. The RSI has started to make higher highs above the 50 handle, indicating that the bulls are starting to gain promising control of momentum. If the RSI can remain above 50, we can expect the market to continue to rise.
Similarly, the moving averages have started to show favor toward the bulls as they gear up for a potential bullish crossover. If the 7-day EMA (blue moving average) can cross up above the 21-EMA (purple moving average), this would constitute a bullish crossover signaling that the bullish pressure is mounting.
Related: Top 8 Privacy Coins