
Ontology, the latest crypto project from Shanghai blockchain company OnChain, has experienced a week of falling prices with a 7.61% reduction over the past 24 hours alone. Ontology is currently trading hands at $4.67 at the time of writing, and has experienced a drop of 2.84% from prices seen 7 trading days ago.
Ontology was released on March 18, 2018 by the same company that birthed the Chinese-based blockchain, NEO. Ontology was created to be a distributed trust collaboration platform that would allow corporations and individuals to assess each other through a platform of identification and trust. The great thing about Ontology is that it is designed to be used by those that have no previous experience with blockchain systems as it has a simple implementation due to its modular nature.
The majority of blockchain systems are complex, however, Ontology has a case to be one of the most complex of them all to understand. For a more in-depth overview of Ontology, we highly recommend our “What is Ontology” guide.
Ontology is currently ranked 23rd in terms of overall market cap across the board, with a total market cap value of $706 million. This is almost $600 million lower than the all-time market cap high of $1.3 billion seen on June 7, 2018.
Ontology is a very young coin trading for only a short few months. This makes it difficult to provide any long term technical analysis. However, we can provide short-term analysis of where the market has been and where it is likely to head toward.
Let us analyze Ontology’s market action over its short lifespan.
Price Analysis
ONT/USD – SHORT TERM – DAILY CHART
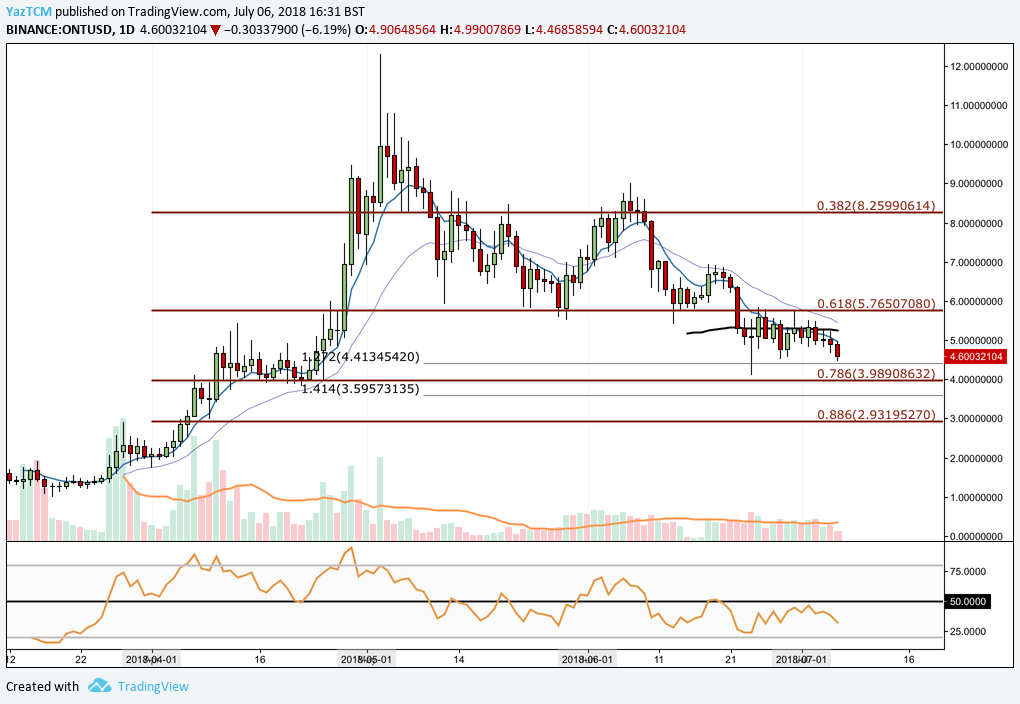
https://www.tradingview.com/x/3CU1DXbu/
Analyzing price action for Ontology over the short run, we can see that the market had experienced a bullish run starting from a low of $1.74 on April 1, 2018, extending all the way to $12.30 on May 3, 2018. This was a price increase of over 130% from low to high over the course of 34 days.
After placing this all-time high, price action went on to decline, falling until finding support at the .618 Fibonacci Retracement priced at $5.76 during May. This is a Fibonacci Retracement taken from the bullish run outline above and is measuring how far the market is likely to fall before continuing its bullish run once again.
The market went on to break below the .618 Fibonacci Retracement during June, creating a strong support level slightly below the $5 handle. We can see that price action was strongly rejected by a 1.272 Fibonacci Extension priced at $4.41 on June 24, 2018. This is a Fibonacci Extension taken from the initial bearish leg seen after the market placed its all-time high extending to the low seen on May 12, 2018.
If the recent bearish action witnessed over the past couple of days continues, we could expect immediate support to be located at the 1.272 Fibonacci Extension priced at $4.41, followed by the .786 Fibonacci Retracement priced at $3.98. If the market can continue further below this level, then further support can be expected at the .886 Fibonacci Retracement priced at $2.93.
Alternatively, if the market can reverse the bearish pressure recently witnessed, the first level of resistance is expected at the .618 Fibonacci Retracement located at $5.76, followed by further resistance at the .382 Fibonacci Retracement priced at $8.25. If the market can continue to break its all-time high around $12, then we expect the first level of contention for the bears to be around the $15.28 level.
The technical indicators are favoring the bears at this moment in time as the RSI trades below the 50 handle, heading toward oversold conditions. If we would like to see some bullish momentum entering the market, we would like to see the RSI battle its way toward the 50 handle and eventually break above the level.
Let us move on to analyze how Ontology has been performing against Bitcoin over its short trading life.
ONT/BTC – SHORT TERM – DAILY CHART
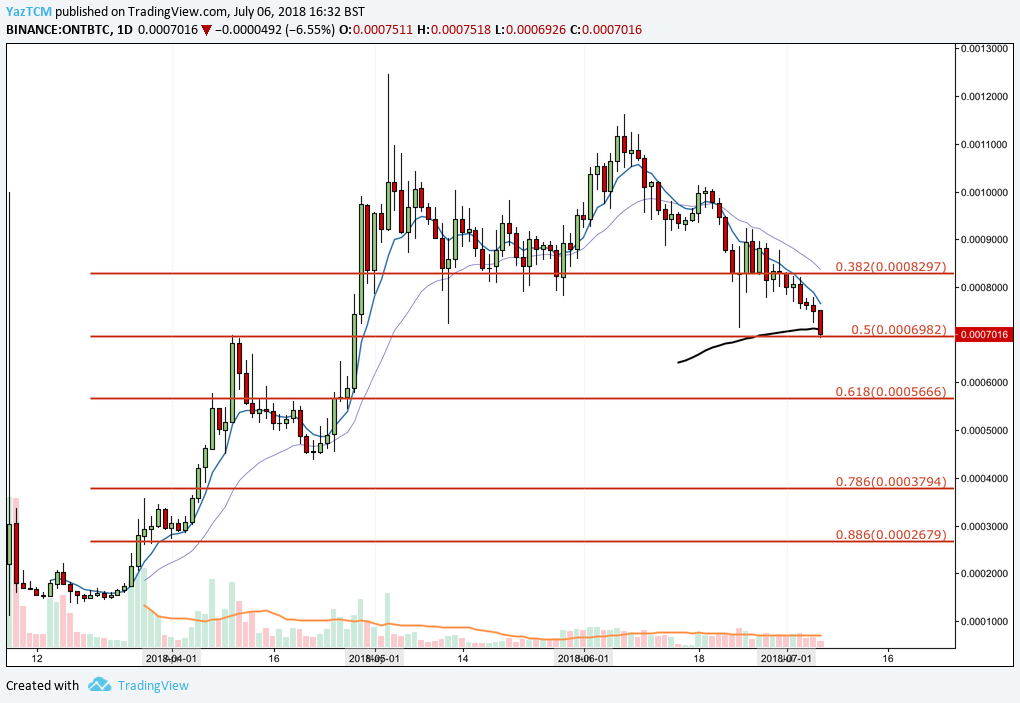
https://www.tradingview.com/x/RuXl8La3/
Analyzing Ontology relative to the price of Bitcoin, we can see that ONT had rocketed during the month of March and April, rising from a low of 1,455 SATS on March 20, 2018, extending all the way to 12,460 SATS experienced on May 3, 2018. This was an extraordinary price increase of 820% from low to high.
After placing the all-time high, we can see that price action went on to deteriorate during May, finding some strong support at the .382 Fibonacci Retracement priced at 8,297 SATS. This is a Fibonacci Retracement taken from the bullish run outline above.
During June, the market managed to stay above the .382 Fibonacci Retracement, even rallying as high as 11,621 SATS for a brief period of time. However, as July began trading, the market rolled over and broke below .382 FIbonacci Retracement, falling until finding support at where it is currently trading located at the .50 Fibonacci Retracement level priced at 6,982 SATS.
If the bearish period recently witnessed continues to push prices lower, then the first region of support is expected at the .618 Fibonacci Retracement level located at 5,666 SATS (YIKES at the 666). Further support below comes in at the .786 Fibonacci Retracement at 3,794 SATS.
Looking at the chart above, we can see that the market had experienced a second bull run starting from April 22, 2018 — let us analyze this bull run a little closer.
ONT/BTC – SHORT TERM – DAILY CHART
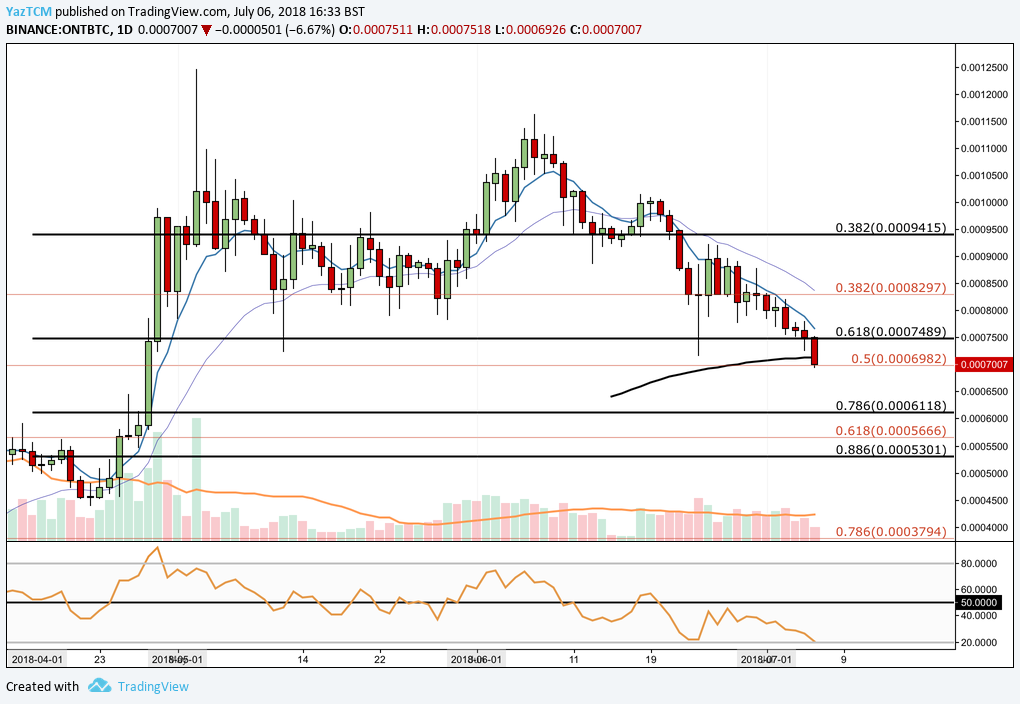
https://www.tradingview.com/x/DStK9Jz6/
Analyzing the recent bull run more closely, we can see that it started from a low of 4,385 SATS on April 22, 2018 and extended all the way to 12,460 SATS on May 3, 2018. This was a price increase of 185% from low to high.
We can see that after placing the all-time high, the market had experienced resistance at the .382 Fibonacci Retracement from the second bull run, marked in black, priced at 9,415 SATS during May. Prices have since fallen lower and have recently penetrated below the .618 Fibonacci Retracement at 7,489 SATS.
If the market does continue lower, near-term support can be found at the short term .786 Fibonacci Retracement level priced at 6,118 SATS.
The RSI is currently trading at extreme oversold conditions near the 20 handle indicating the extreme bearish pressure recently witnessed. If we would like to see this bearish pressure begin to subside, we would like to see the RSI indicator make its way back toward the 50 handle.
Conclusion
Cryptocurrencies are always evolving at an extreme pace. Ontology seems to be the latest evolution of blockchain with an extremely broad vision of global adoption. The well-experienced team behind Ontology has a long road ahead of them to deliver on all goals they have set out to achieve.
With the launch of Ontology mainnet a few days ago, the immediate future of Ontology looks promising.
Ontology is a very young blockchain with a bright future ahead of itself, we will closely monitor any developments that are released by the Ontology team.