
- Ontology has recently broken below the $1.00 handle for the first time since its inception.
- The market has found recent solid support at the $0.77 handle.
- Support moving forward: $0.7755, $0.70, $0.65, $0.60, $0.5479, $0.50, $0.4108.
- Resistance moving forward: $0.9622, $1.00, $1.09, $1.22, $1.37, $1.55, $1.69, $1.80, $2.00.
Ontology has seen a small price decline totaling 2.23% over the past 24 hours of trading. The Ontology market is currently exchanging hands at around $0.8094, at the time of writing, after seeing a rocky 7-day trading period where price action fell by a total of 14.35%.
Now sitting in 25th position in terms of overall market cap, Ontology has a total market cap value of $235 million. The cryptocurrency has seen a drastic 50% price plummet over the past 30 trading days as the 9-month old coin now trades at a value that is 92% lower than its all-time high price.
Let us continue to analyze price action for Ontology over the long term and gather an insight on the overall market behavior.
Ontology Price Analysis
ONT/USD – LONG TERM – DAILY CHART
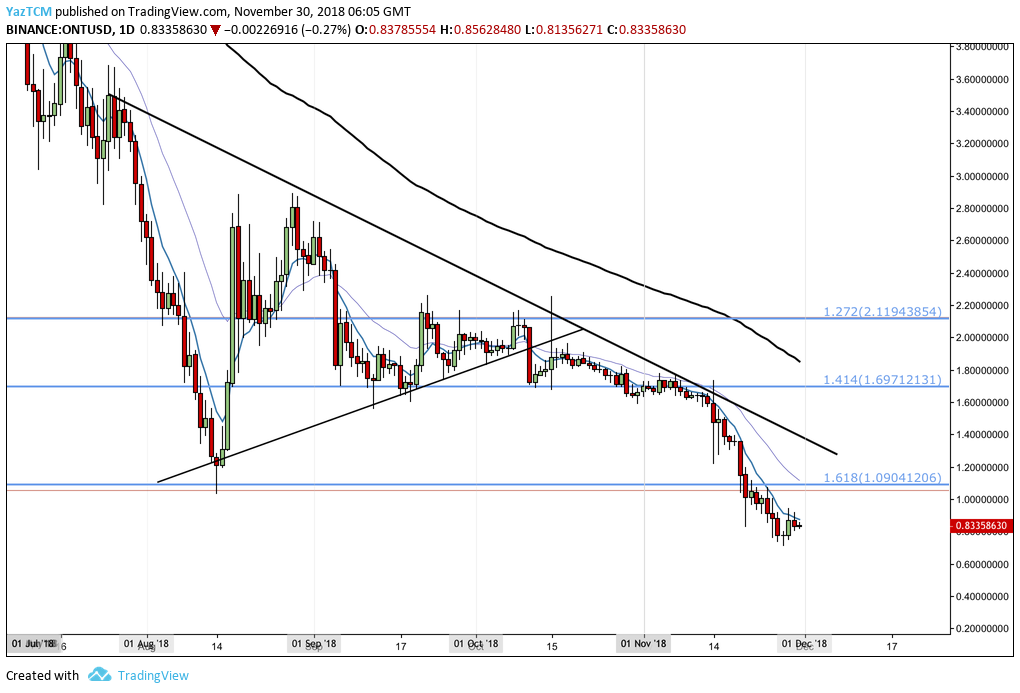
Looking at the market from the long-term perspective, we can see that price action has broken below the symmetrical triangle highlighted in our previous technical analysis article for Ontology.
After ONT/USD penetrated below the lower boundary of the triangle, it had found some relatively strong support at the downside 1.414 Fibonacci Extension level priced at $1.67. However, as the market collapse unfolded during November 2018, ONT/USD slipped lower and created fresh all-time lows.
Let us continue to take a look at ONT/USD over the short term and highlight any potential areas of support and resistance moving forward.
ONT/USD – SHORT TERM – DAILY CHART
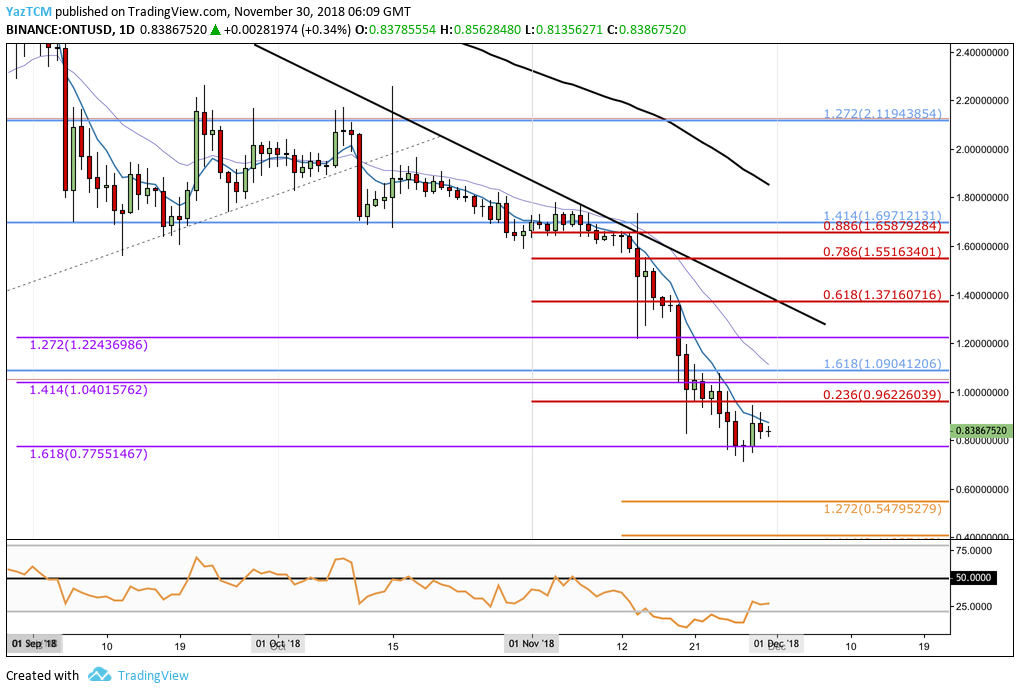
From a closer perspective, we can see that ONT/USD had recently found a form of solid support at a medium-term downside 1.618 Fibonacci Extension level (drawn in purple) priced at $0.7755. The previous market downturn had found some area of refuge as ONT/USD reached this area of support, which allowed ONT/USD to rebound slightly.
ONT/USD had attempted to close above the 7-day EMA (blue moving average) but failed to do so during the past 3 trading sessions. The market is now trading at the $0.8386 handle.
Moving forward, if the sellers resume their previous aggression and begin to drive price action lower, we can expect immediate support below to be located at the downside 1.618 FIbonacci Extension level (drawn in purple) priced at $0.7755. Further support located below this can then be expected at the psychological round number handles at $0.70 and $0.60.
If the bears continue to push further below $0.60, more support beneath can be expected at the short-term downside 1.272 and 1.414 Fibonacci Extension levels (drawn in orange), priced at $0.5479 and $0.4108 respectively.
On the other hand, if the bulls can regroup and begin to seriously push price action higher, they will meet immediate resistance above at the short-term bearish .236 Fibonacci Retracement level priced at $0.9622, followed by further strong support at the round number $1.00 handle.
If the buyers can continue to drive ONT/USD even higher, then more resistance above can be located at the previous downside 1.272 Fibonacci Extension level (drawn in purple) priced at $1.2243, followed by more resistance at the bearish .618 FIbonacci Retracement level (drawn in red) priced at $1.37.
In the case that price action proceeds above $1.37, there is more resistance above at the bearish .786 Fibonacci Retracement level (drawn in red) priced at $1.55, followed by the previous long-term downside 1.414 Fibonacci Extension level (drawn in blue) priced at $1.6971.
The RSI has recently risen up out of oversold conditions as it makes its way back toward the 50 handle. The rising RSI may indicate that the sellers are beginning to stop their selling or that they are just needing a short break before continuing.
If the RSI can break above the 50 handle, we can expect ONT/USD to travel higher as the bulls would then be in control of the market momentum.
Let us continue to analyze price action for ONT/BTC over the short term and highlight any potential areas of support and resistance moving forward.
ONT/BTC – SHORT TERM – DAILY CHART
For a more in-depth overview of ONT/BTC over the long term we recommend quickly revisiting our previous ONT price analysis article.
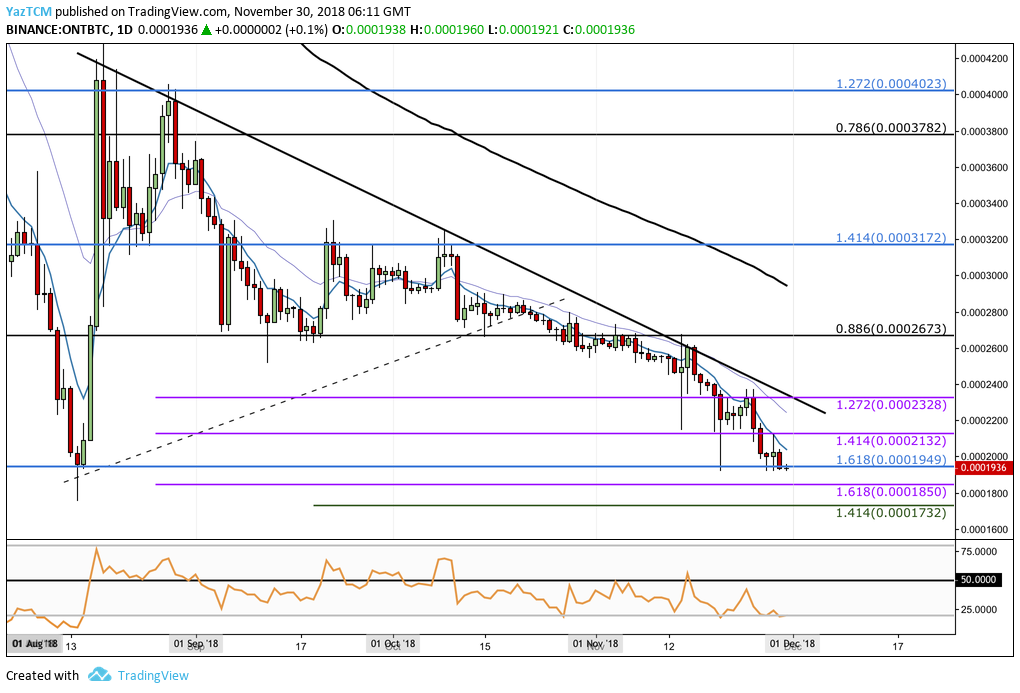
Taking a look at the short-term perspective above for ONT/BTC, we can see that the market had also fallen below its symmetrical triangle pattern highlighted in our last article in October 2018.
After breaking below the lower boundary of the triangle, the market continued to collapse further until it recently found support at a long-term downside 1.618 Fibonacci Extension level (drawn in blue) priced at 1,949 SATS, where the market is currently trading at the time of writing.
Looking ahead, if the sellers continue with their dominance and penetrate below the 1,949 SATS support handle, we can expect immediate support beneath to be located at the short-term downside 1.618 FIbonacci Extension level (drawn in purple) priced at 1,850 SATS.
Further support below this can then be expected at the short-term downside 1.414 Fibonacci Extension level (drawn in green) priced at 1,732 SATS.
Alternatively, in our bullish outline, if the buyers can begin to form a recovery within ONT/BTC, we can expect immediate resistance higher to be located at the previous short-term downside 1.414 and 1.272 Fibonacci Extension levels (drawn in purple), priced at 2,132 SATS and 2,328 SATS respectively.
If the bulls continue to push price action even higher, then we can expect more resistance above to be located at the long-term .886 Fibonacci Retracement level (drawn in black) priced at 2,673 SATS, followed by the previous long-term downside 1.414 Fibonacci Extension level (drawn in blue) priced at 3,172 SATS.
The RSI is trading within extreme oversold conditions within this market. If we would like to see the ONT/BTC make any form of recovery ,we would need to see the RSI begin to rise and head toward the 50 handle.