
OmiseGO, over the past 24 hours, has seen a small price increase totaling 2.83%. OMG, the cryptocurrency behind OmiseGO, is currently trading at a price of $3.54.
The OMG/USD market has been trading in a sideways manner over the previous 4 weeks, as traders wait patiently for a positive break toward the upside.
The technical indicators have recently swung in favor of the bulls which could indicate that the OMG/USD market is priming itself to break above the range.
OMG currently holds the 23rd position in terms of overall market cap across the entire industry. It has a market cap value of $495 million after the 15-month old coin saw a 46% price decline over the past 90 trading days. The current price of OMG is 86% lower than its all-time high (ATH) price.
OmiseGO Price Analysis
OMG/USD – LONG TERM – DAILY CHART
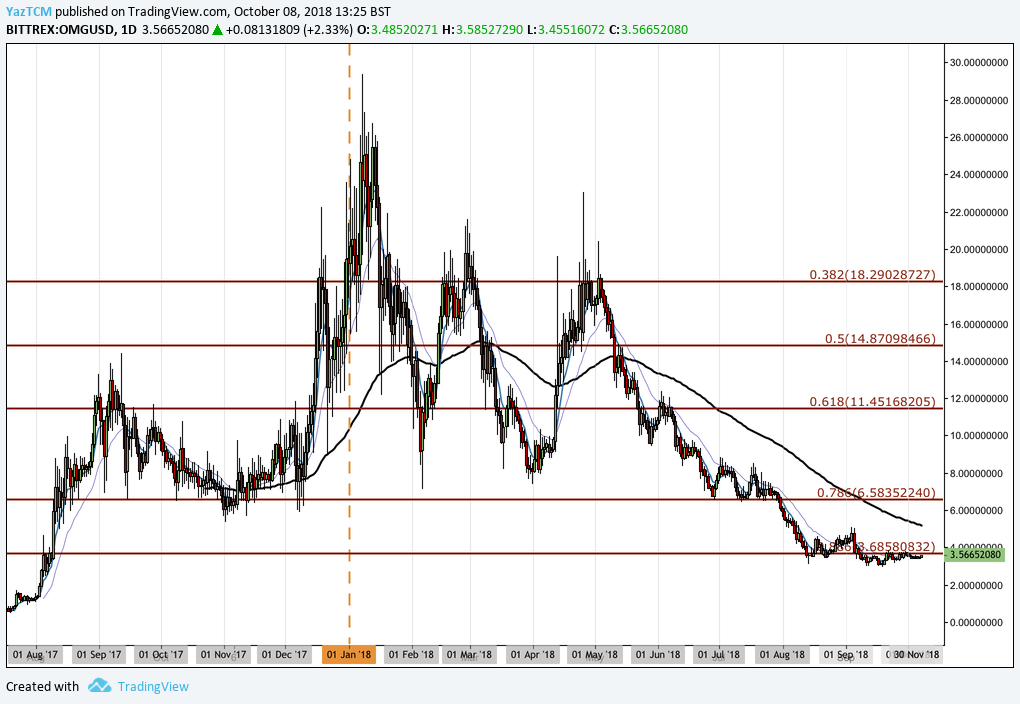
Analyzing the market from the long-term perspective above, we can see that the OMG/USD market had experienced a bullish wave when price action began from a low of $0.38 on July 17, 2017 and extended to an ATH of $29.37 on January 8, 2018. This price increase totaled over 6,000% from low to high.
After the market reached the ATH, it began to decline, originally finding support at the .5 Fibonacci Retracement level priced at $14.87 in January 2018. This Fibonacci Retracement is measured from the entire bullish run outline above.
However, price action was not able to remain above the .5 Fibonacci Retracement for very long, and continued to decline until finding further support at the .786 Fibonacci Retracement priced at $6.58 in July 2018.
We can see that price action was supported by this level during all of July 2018. However, when August 2018 began, price action dipped further below, dropping underneath the .886 Fibonacci Retracement level priced at $3.68.
Let’s look at a shorter time horizon and highlight any potential support and resistance areas.
OMG/USD – SHORT TERM – DAILY CHART
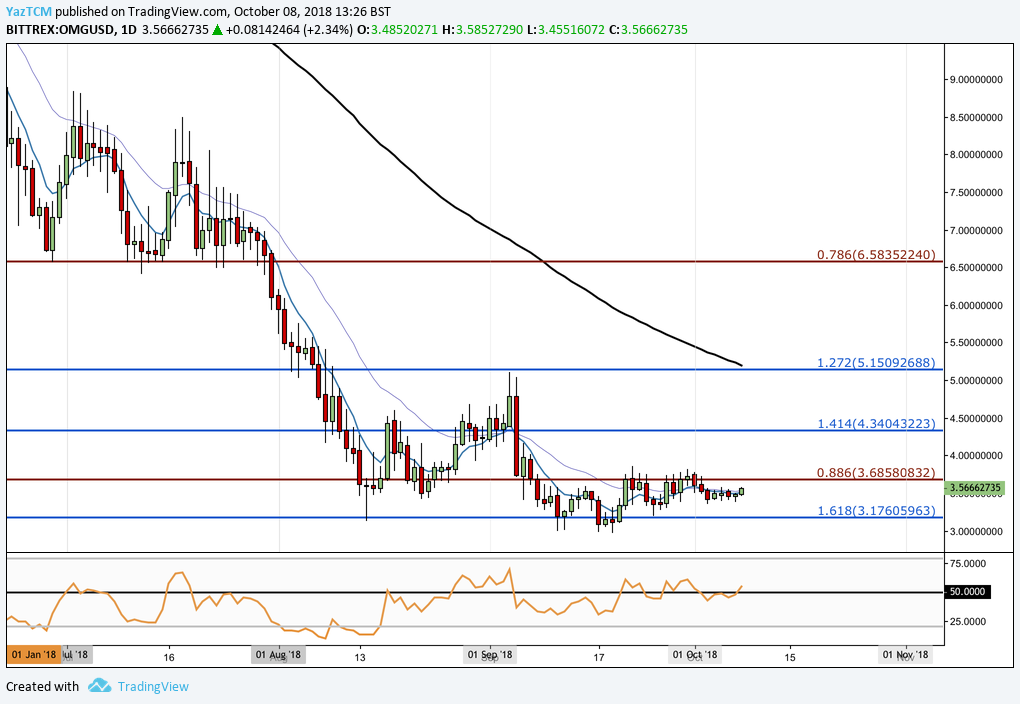
Analyzing the market from the short-term perspective above, we can see that price action had found support in August 2018 at a downside 1.618 Fibonacci Extension level priced at $3.17. This price level provided support for the market during both August and September 2018, maintaining the market above the $3 handle.
We can also see that over the past 4 trading weeks, the market has now established a very narrow trading range bound between the downside 1.618 Fibonacci Extension level priced at $3.17 as the lower boundary and the long-term .886 Fibonacci Retracement level priced at $3.68 as the upper boundary of the range.
In the event that the bears push price action lower, we expect immediate support to be located at the lower boundary of the range priced at $3.17. If the bears do manage to push price action below this level, then we can expect significant support to be located at the psychological round number handle of $3.
Alternatively, if the bulls can push the OMG/USD market above the upper boundary of the range at $3.68, we can expect immediate significant resistance above to be located at the downside 1.414 Fibonacci Extension level priced at $4.32.
Resistance expected above this level can then be located at the 1.272 Fibonacci Extension level priced at $5.15. This level of resistance will require significant momentum to overcome due to the 100-day moving average closely hovering within the price area, which adds to the expected resistance.
If the bulls can then continue to push the market even higher, we can expect more resistance above at the .786 Fibonacci Retracement level priced at $6.58.
After printing neutral readings for a few weeks, the RSI technical indicator has recently swung in favor of the bulls as the RSI breaks above the 50 handle. This indicates that the bulls are in control of the momentum within the market. If the RSI can remain above 50, we can expect this market to continue to make further gains.
Let us continue to quickly analyze price action for OMG/BTC over the long term.
OMG/BTC – LONG TERM – DAILY CHART
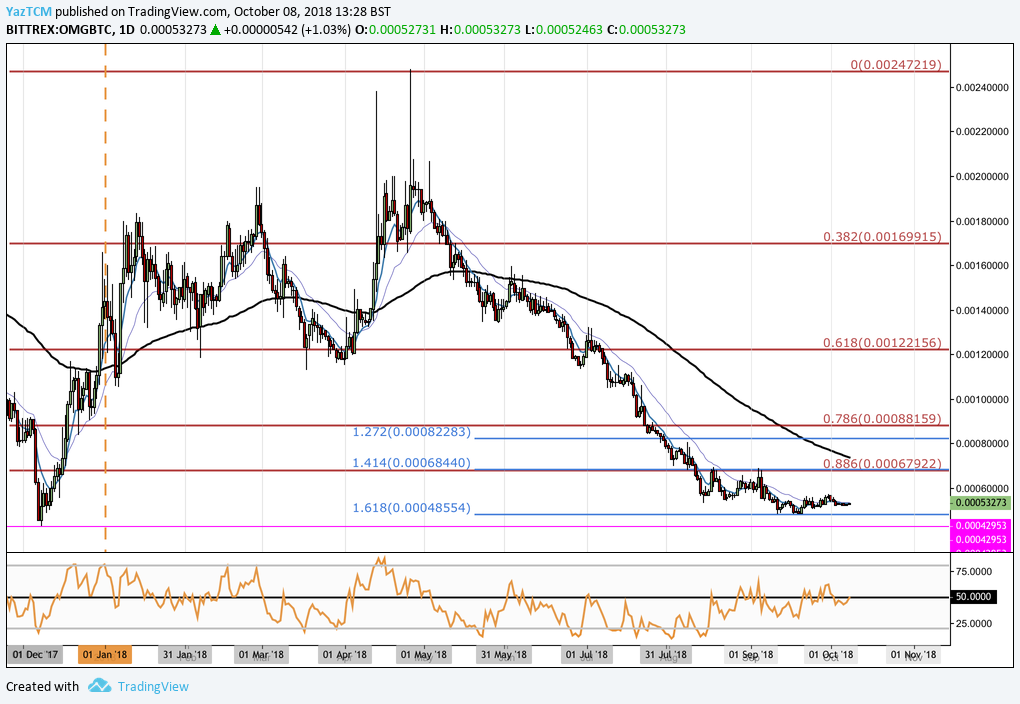
Analyzing the market action for the OMG/BTC market over the long term, we can see that price action had experienced a large bullish run. OMG/BTC started from a low of 43,132 SATS on December 8, 2017 and extended to an ATH price of 247,845 SATS on April 26, 2018. This was a price increase totaling 470% from low to high.
We can see that since placing the ATH, price action has rolled over and has continuously declined throughout the trading year.
It had recently dipped below the .886 Fibonacci Retracement level priced at 67,922 SATS during August 2018 and continued to drop until finding further support below at the downside 1.618 Fibonacci Extension level priced at 48,554 SATS during September 2018.
Moving forward, if the bears push price action lower, we can immediately expect support at the downside 1.618 Fibonacci Extension level priced at 48,554 SATS. If the bears push price action below this support level, then the next level of significant support will be expected at the initial starting point of the December 2017 bull run priced at 43,132 SATS.
Alternatively, if the bulls can push price action higher, the first level of significant resistance is expected at the .886 Fibonacci Retracement level priced at 67,992 SATS. This area of resistance is further bolstered by the downside 1.414 Fibonacci Extension level which is priced in the exact same area.
Further resistance higher can then be expected at the .786 Fibonacci Retracement level priced at 88,159 SATS, followed by the 100,000 SATS handle.