
NXT has seen a 1.43% price decline over the past 24 hours of trading. The cryptocurrency is currently exchanging hands at a price of $0.0684 after seeing a 10.19% price drop over the past 7 trading days.
NXT was founded in November 2013, making it one of the oldest cryptocurrencies behind Bitcoin. It was founded by an anonymous developer named BTCNext, and was taken over by the company called Jelurida B.V.
The entire NXT codebase is a fresh new batch of code that isn’t copied and pasted from Bitcoin. In fact, it is written from the ground up in a common coding language known as Java. It is commonly described as a second generation blockchain as it can host a plethora of decentralized apps on its platform.
Along with the capability of hosting dapps, the NXT platform also offers a monetary system to create and distribute tokens, a marketplace to buy and sell digital goods, encrypted messaging in all transactions, coin shuffling to provide anonymity and a data cloud where users can upload their private files instead of using a service such as DropBox or Google Drive.
For more information on NXT we recommend you read our “What is NXT” guide.
NXT is currently ranked 85th in terms of overall market cap across the entire industry. The 57-month old coin currently has a total market cap value of around $68 million after seeing a 48% price drop over the last 90 trading days.
Let us continue to analyze price action for NXT over the long term.
NXT Price Analysis
NXT/USD – LONG TERM – DAILY CHART
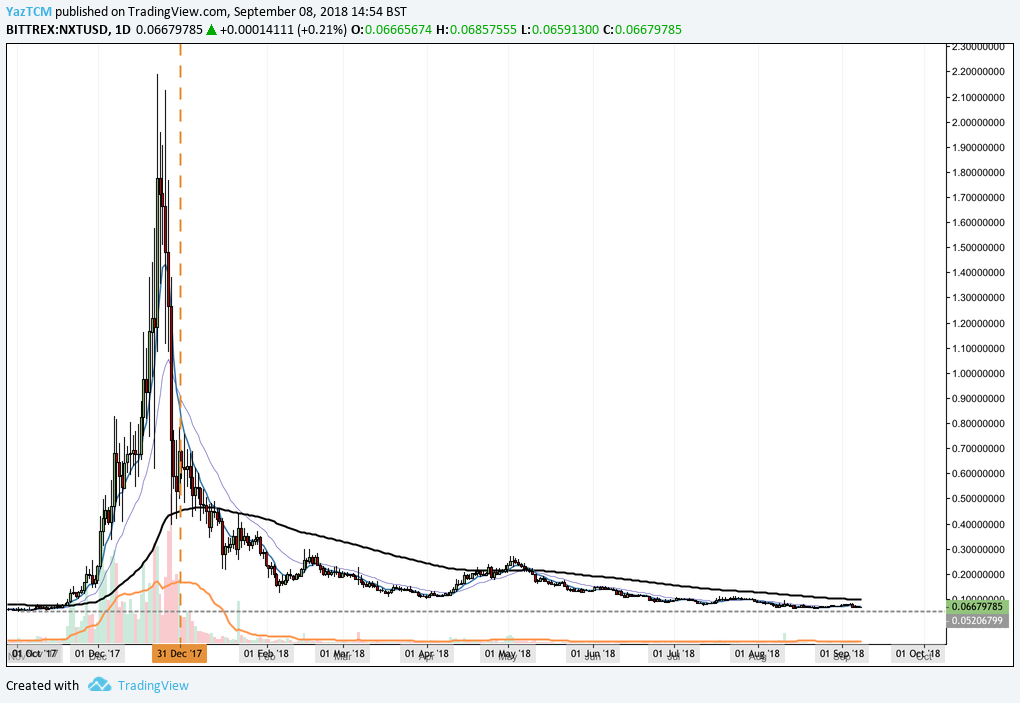
Analyzing the market from the long-term perspective above, we can see that price action had experienced an incredible wave of bullish action toward the end of 2017 when the market started from a low of $0.0031 on the November 6, 2017 and extended to an all-time high (ATH) of $2.189 on December 23, 2017. This was a total price increase of over 3,500% from low to high.
We can see that after placing the ATH, price action rolled over and declined rapidly. It fell underneath the 100-day moving average in January 2018, and has not since been able to hold a sustained break above.
Price action continued to decline throughout the rest of the year as it begins to approach the initial starting low price level of the entire bullish run outlined above.
Let us continue to analyze price action a little closer over the shorter term and highlight any potential support and resistance areas.
NXT/USD – SHORT TERM – DAILY CHART
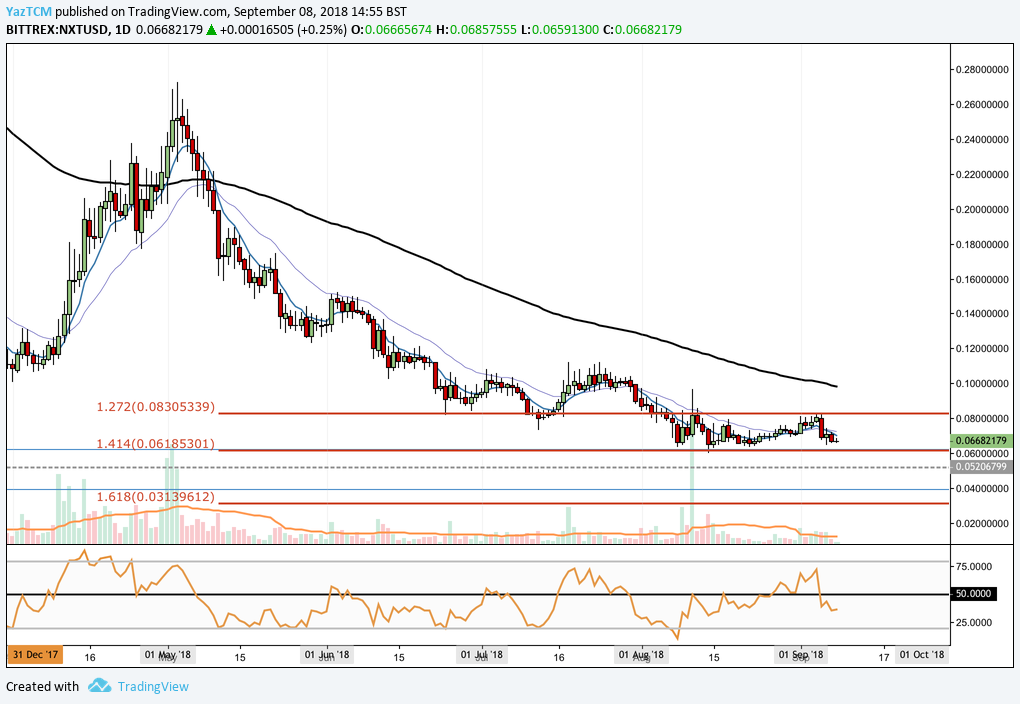
Analyzing price action from the short-term perspective above, we can see that the market has approached a strong from of support at a short-term downside 1.414 Fibonacci Extension level (drawn in red) priced at $0.06185. This support level has held the market for the entire period of August 2018, and is expected to continue to hold throughout September 2018.
It is important to highlight that this area of support is significantly bolstered by a further longer-term downside 1.272 Fibonacci Extension level (drawn in blue) priced in the same area, adding to the level of support expected within this area.
We can also see that the market has been trapped within a range for the majority of August, bound between the downside 1.414 Fibonacci Extension level priced at $0.06185 as the lower boundary and the downside 1.272 Fibonacci Extension level priced at $0.08305 as the upper boundary.
If the market continues lower, we expect the lower boundary at $0.06185 to provide ample support to hold the market up. If the market does indeed penetrate below the lower boundary, then we expect immediate support to be then located at the November 2017 market low priced at $0.05206.
Further support below this can then be expected at the psychological round number handle of $0.04, which also contains the longer-term downside 1.272 Fibonacci Extension level (drawn in blue) followed by short-term downside 1.618 Fibonacci Extension level (drawn in red) priced at $0.031.
Alternatively, if the bulls can push price action back above the upper boundary of the range priced at $0.083, then we expect immediate resistance above to be located at the 100-day moving average level which currently hovers around the $0.1 handle. Further support above this level will then be expected at July 2018’s highs priced at $0.112, followed by June 2018’s highs priced at $0.152.
The technical indicators within the market are currently slightly favoring the bears at this moment in time. The RSI is trading underneath the 50 handle, indicating that the bears are in control of the momentum within the market. If the RSI can break back above the 50 handle, we can expect this market to make further gains higher.
Let us continue to analyze price action relative to BTC over the short term and highlight any potential support and resistance areas.
NXT/BTC – SHORT TERM – DAILY CHART
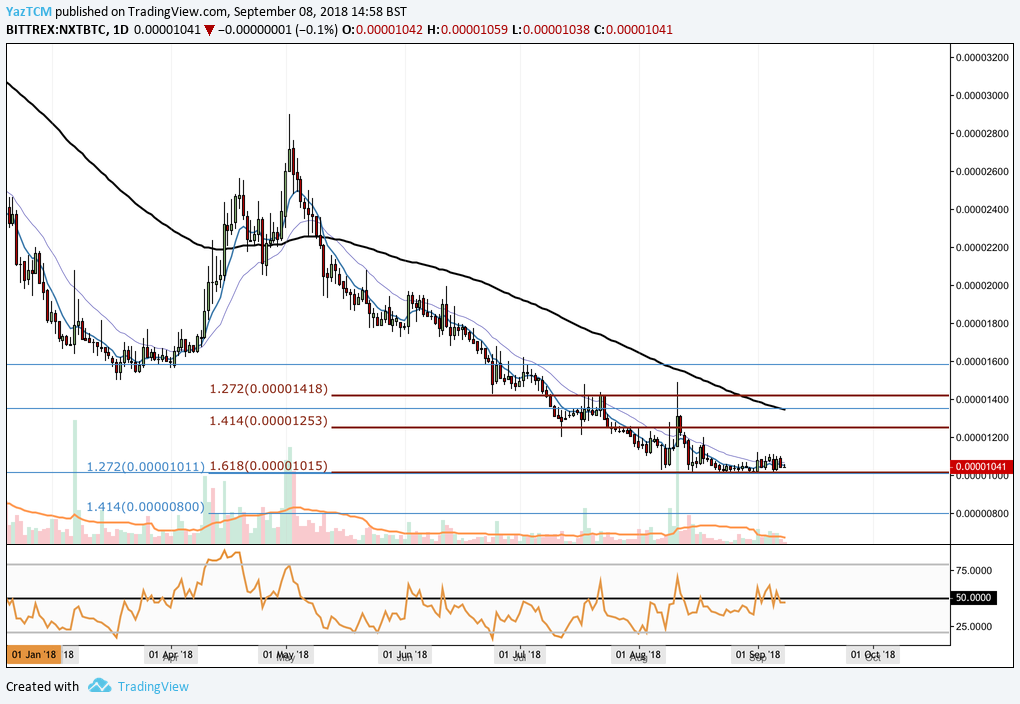
Analyzing the market from the short-term perspective above, we can see that price action has found support during August 2018 marked by a short-term downside 1.618 Fibonacci Extension level (drawn in red) priced at 1,015 SATS. We can see that as the market has managed to remain supported at this level for the entire August 2018 trading period.
It is important to highlight that this area of support is also re-enforced by a longer-term downside 1.618 FIbonacci Extension level priced in the same area.
If the bulls manage to keep the market above the identified support level, then we can expect the nearest level of resistance to be located at the downside 1.414 Fibonacci Extension level (drawn in red) priced at 1,253 SATS, followed by resistance located at the 100-day moving average priced at around 1,400 SATS.
Alternatively, if the bearish pressure continues and penetrates the market below the support at 1,015 SATS, then we expect immediate further support below to be located at the 800 SATS handle.
The technical indicators within the market are currently producing neutral readings as the RSI is hovering at the 50 handle, unable to decide which direction to next head towards. If the RSI breaks above the 50 handle, we can expect the market to continue to make some gains. However, if the RSI breaks below the 50 handle, we could expect the market to fall below the 1,000 SATS support level.
Related: QASH Price Analysis: QASH Remains Stable as the Rest of the Cryptocurrency Market Tumbles