
Nuls has seen a small 1.88% price increase over the past 24 hours of trading. The cryptocurrency is currently exchanging hands at a price of $1.09, after suffering a 9.55% price decrease over the past 7 trading days.
The Nuls platform is a community-based cryptocurrency project that is a platform dedicated to users creating their own private blockchains. Currently if a user wants to create their own blockchain, they would need to hire a developer with highly specialized programming knowledge.
Nuls is aiming to reduce the costs of creating a private blockchain.
The platform works on a modular-based structure which allows users to create private blockchains which are also plug-and-play with the main Nuls blockchain. This creates a seamless easy-to-use interface that reduces the barrier to entry for blockchain development.
The Nuls token was airdropped to Binance users during November 2017, after it was created by veteran developer Lin Yang. The cryptocurrency uses a Proof-of-Concept consensus mechanism, which is similar to PoS but relies on a new system of credit.
The platform also offers a virtual machine which will execute smart contracts, similar to the way that Ethereum does. This will allow developers to come and build dapps on top of the Nuls blockchain.
Nuls is currently ranked 109th in terms of overall market cap rankings across the entire industry. It has a total market cap value of $43.58 million after the 11-month old coin suffered a 51% price decline over the past 90 trading days. Nuls is currently trading at a price that is 86% lower than its all-time high price of $8.79.
Let us continue to analyze price action for Nuls over the long term.
Nuls Price Analysis
NULS/USD – LONG TERM – DAILY CHART
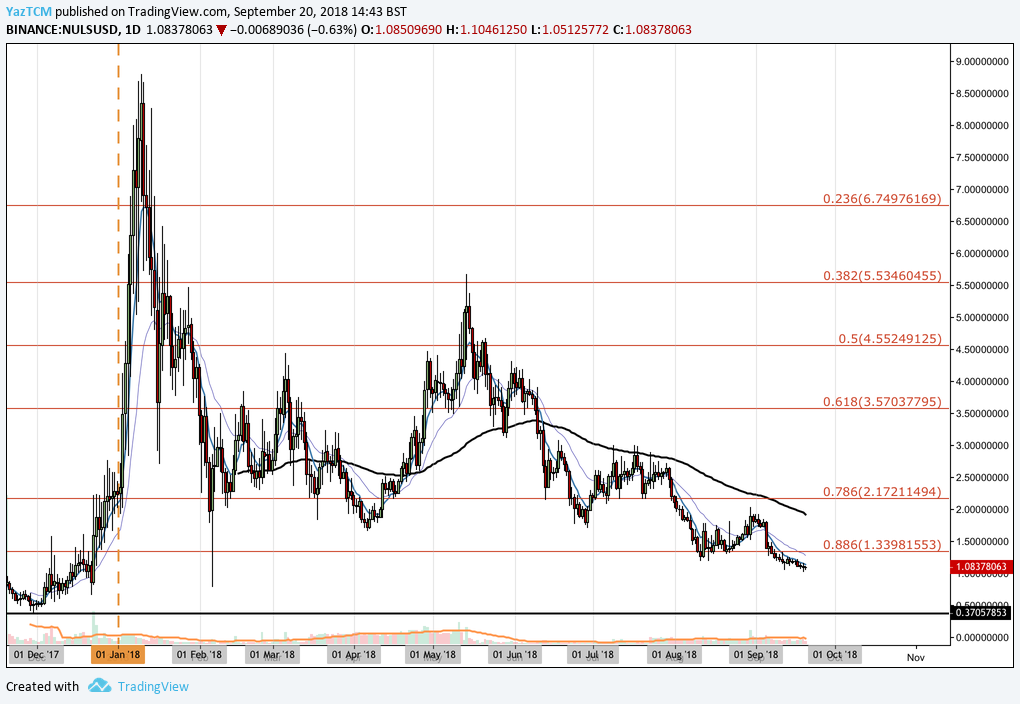
Analyzing the market from the long-term perspective above, we can see that Nuls had experienced an incredible bullish run towards the end of 2017. Price action started from a low of $0.37 on November 30, 2017 and extended to an all-time high price of $8.79 on January 1,0 2018. This was a price increase totaling around 3,100% from low to high.
We can see that after placing the all-time high, price action rolled over and rebounded significantly. It had originally found support at a .786 Fibonacci Retracement level priced at $2.17 in February 2018. This support level held for the majority of the year as price action only dipped below it momentarily in April and June 2018.
However, when the overall market bloodbath of August 2018 unfolded, price action dipped below our support level. It continued to fall until it found further support at a .886 Fibonacci Retracement level priced at $1.33 in August 2018.
The market continued to fall during September 2018, dipping below the .886 Fibonacci Retracement level to where it is currently trading, slightly above the $1.00 handle at $1.08.
Let us continue to analyze price action for the market over the short term and highlight any potential support and resistance areas.
NULS/USD – SHORT TERM – DAILY CHART
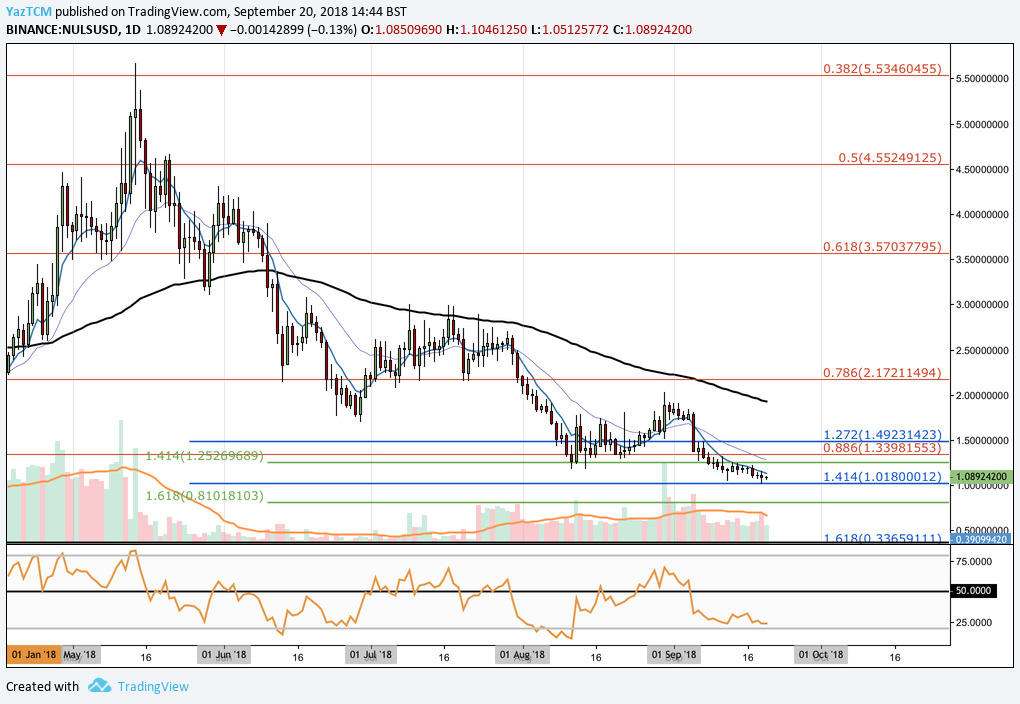
Analyzing price action from the short-term trading perspective above, we can see that the market has recently found support at a downside 1.414 Fibonacci Extension level (drawn in blue) priced at $1.01. As the market had approached this area, price action was rejected, causing price to rebound.
We can also notice that the market has been trapped between a range established with the $1.01 handle as the lower boundary of the range and a short-term downside 1.414 Fibonacci Extension level (drawn in green) priced at $1.25 as the upper boundary of the range.
The $1.25 handle had provided significant support for the market during August 2018, and therefore it is expected to provide significant resistance moving forward (old support becomes new resistance).
Moving forward, if the bulls can take control of the momentum within the market and push price action higher, we expect immediate resistance to be located at the upper boundary of the range at $1.25. If price action can continue further higher above the trading range, then we expect further resistance higher to initially be located at the long term .886 Fibonacci Retracement level priced at $1.33, followed by the previous downside 1.272 Fibonacci Extension level (drawn in blue) priced at $1.49.
If the bulls can push market action even higher, then further resistance can be located at the psychological round number handle of $2.00. This area will require significant volume and momentum to overcome due to the 100-day moving average being closely located within this area.
Alternatively, any negative pressure is expected to be absorbed by the lower boundary of the trading range priced at $1.01. If the bears do manage to cause price action to penetrate below the $1.00 handle, then we expect immediate further support lower to be located at the downside 1.618 Fibonacci Extension level (drawn in green) priced at $0.81.
The technical indicators within the market are currently heavily favoring the bears at this moment in time. The RSI is trading well below the 50 handle trading at oversold conditions. This indicates that the bears are fully in control of the momentum within the market.
If we are to see the market regain some of its losses, we would need to see the RSI make its way back toward the 50 handle.
Let us quickly analyze price action for Nuls relative to BTC over the long term and highlight any potential support and resistance areas.
NULS/BTC – LONG TERM – DAILY CHART
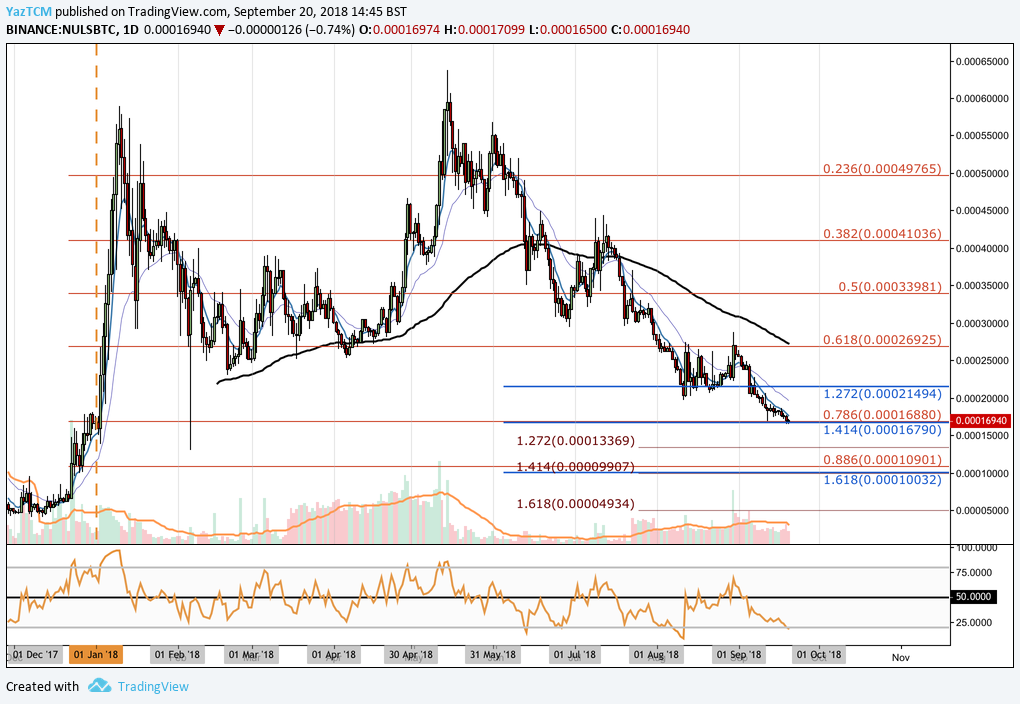
Analyzing price action relative to Bitcoin over the long term, we can see that Nuls had experienced a significant bullish run towards the end of 2018. The market started from a low of 4,057 SATS on December 12, 2017 and extended to a high of 58,990 SATS on January 10, 2018. This was a price increase of 1,372% from low to high.
We can see that price action has been declining since August 2018 as it now approaches support at the .786 Fibonacci Retracement level priced at 16,880 SATS. This Fibonacci Retracement is measured from the entire bullish run outlined above.
We can see that this area of support is significantly bolstered by a downside 1.414 Fibonacci Extension level (drawn in blue) priced at 16,790 SATS.
Moving forward, if the bulls can regather momentum at this support level and push the market higher, we expect immediate resistance to be located at the downside 1.272 Fibonacci Retracement level priced at 21,494 SATS. Further resistance above this level will then be expected at the .618 FIbonacci Retracement level priced at 26,925 SATS.
Alternatively, if the bears push price action below the 16,880 SATS handle, then immediate support below is expected at a short-term downside 1.272 FIbonacci Extension level (drawn in red) priced at 12,269 SATS. Support below this can then be expected at the .886 Fibonacci Retracement level priced at 10,901 SATS.
The technical indicators within the market are also heavily leaning toward the bears’ favor at this moment in time. The RSI is also trading at oversold conditions within this market, indicating that the bears are fully in control of the momentum. For a sign that the bearish pressure is fading, we will look for the RSI to head back toward the 50 handle.
Related: NULS Releases Mainnet, Unveils Plans for the Future