
Nano has suffered a 8.76% price drop over the past 24 hours of trading — however, this comes after the cryptocurrency experienced a significant 63% price hike over the past 7 trading days. Nano is currently exchanging hands at a price of $3.10, and has seen a 46% price increase over the past 30 trading days.
Nano is a cryptocurrency that was rebranded from RaiBlocks in January 2018. It was founded by Colin LeMahieu in 2015 and was rebranded for a more mainstream appeal.
The cryptocurrency offers a zero fee, trustless and instant transaction protocol that upholds the security provided by blockchains. However, it doesn’t use blockchains in the same way that most cryptocurrencies do. Instead, the Nano ecosystem is run through a DAG where all transactions are directly linked to one another. Each Nano wallet has their own private blockchain which they maintain.
These two factors combined allow the Nano network to be scalable to a high degree, relative to the rest of the cryptocurrency market.
On August 18, 2018, the Nano team conducted a stress test upon the network and reported a solid 750 transactions per second (TPS) from the test. TPS has been one of the focal topics within the scalability debate.
At this moment in time, Bitcoin can handle only 7 TPS and Ethereum can only handle around 20 TPS. These figures are far below the required number of TPS for the cryptocurrencies to go mainstream. This was highlighted in December 2018 when transaction fees soared due to high demand and backlog of transactions on the network.
Nano has created a system that could possibly rectify the scalability issue but only time will tell as to which is the best option. For more information on Nano we highly recommend our “What is Nano” guide.
Nano is currently ranked 26th in terms of overall market cap across the entire industry. It has a total market cap value of $412 million as the coin has suffered a 26% price decline over the past 90 trading days.
Let us continue to analyze price action for Nano over its short lifetime.
Nano Price Analysis
NANO/USD – LONG TERM – DAILY CHART
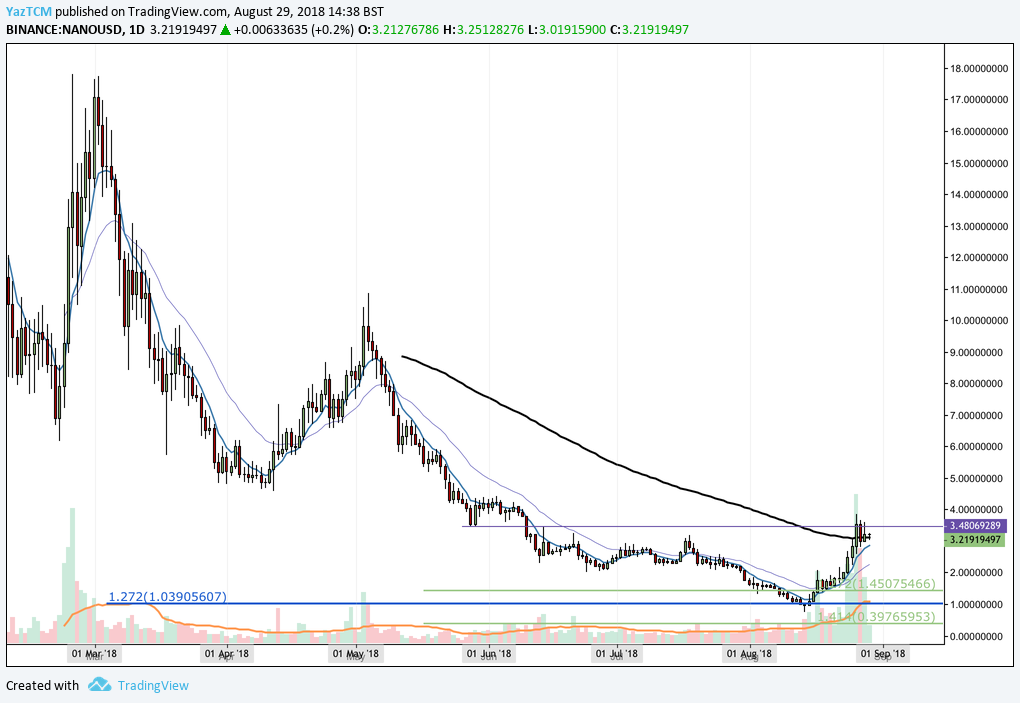
Analyzing price action from the long-term perspective above, we can immediately see that the trading year has not been very kind to Nano. It started off well when price action started from a low of $6.15 on February 21, 2018 and extended to an all-time high of $17.64 on March 1, 2018, which was a 186% price increase from low to high. However, price action was not able to maintain itself at these high levels and proceeded to roll over.
Price action fell throughout March 2018 until minor support was reached at the $5 handle in April 2018, where a small relief rally was experienced. Price action continued with its decline throughout May, June and July 2018 until support was found at a long-term downside 1.272 Fibonacci Extension level priced at $1.03. This support proved to be strong as the market rebounded from this level.
Let us continue to analyze price action a little closer over the short term to highlight any potential support and resistance areas.
NANO/USD – SHORT TERM – DAILY CHART
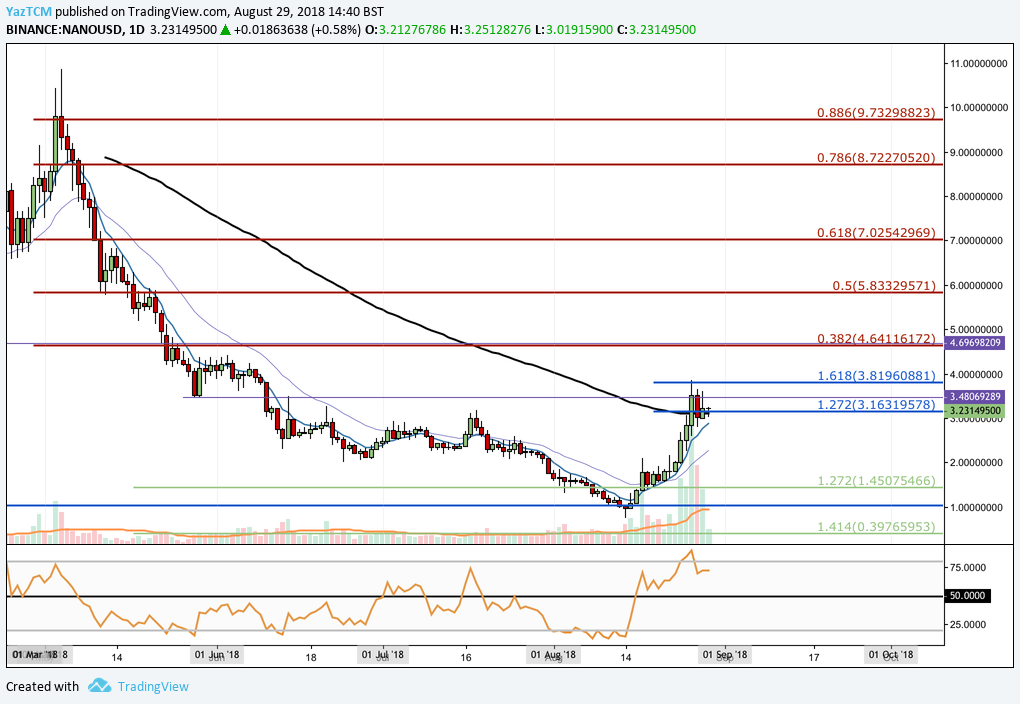
Analyzing price action from the short-term perspective above, we can see that the recent bullish action has met resistance at a short-term 1.618 Fibonacci Extension level (drawn in blue) priced at $3.81. The market has since fallen, and is now trading at support marked by the 100-day moving average level and the 1.272 Fibonacci Extension level.
If price action can maintain itself above the $3.16 handle and continue higher, we expect immediate resistance at the 1.618 Fibonacci Extension at $3.81. Further resistance above this level can be expected at the bearish .382 Fibonacci Retracement level (drawn in red) priced at $4.64.
This Fibonacci Retracement is measured from the high of $10.86 seen on May 4, 2018 to the low of $0.74 witnessed recently on August 14, 2018. If the market can continue even higher, resistance can be expected at the .5 and .618 Fibonacci Retracement levels priced at $5.58 and $7.02 respectively.
Alternatively, if the bears re-enter the market and push price action below the $3.16 handle, we expect immediate support to be located at the psychological round number handle of $3.00. This support price handle is bolstered by previous July 2018’s high day close level (previous resistance now support). Further support below this level can be expected at $2.50 followed by $2.00.
The technical indicators within the market are heavily favoring the bulls at this moment in time. On August 15, 2018, the RSI broke above the 50 handle and continued to rise to overbought conditions. This indicates that the previous bearish momentum witnessed within the market has faded and that the bulls have now begun to retake control.
Similarly, the moving averages are showing favor that leans towards the bulls as the 7-day EMA has crossed above the 21-day EMA. So long as the 7-day EMA does not cross back below the 21-day EMA, then we can expect the bullish pressure within the market to continue.
Let us quickly move on to analyze price action relative to BTC over the long term and highlight any potential support and resistance areas.
NANO/BTC – LONG TERM – DAILY CHART
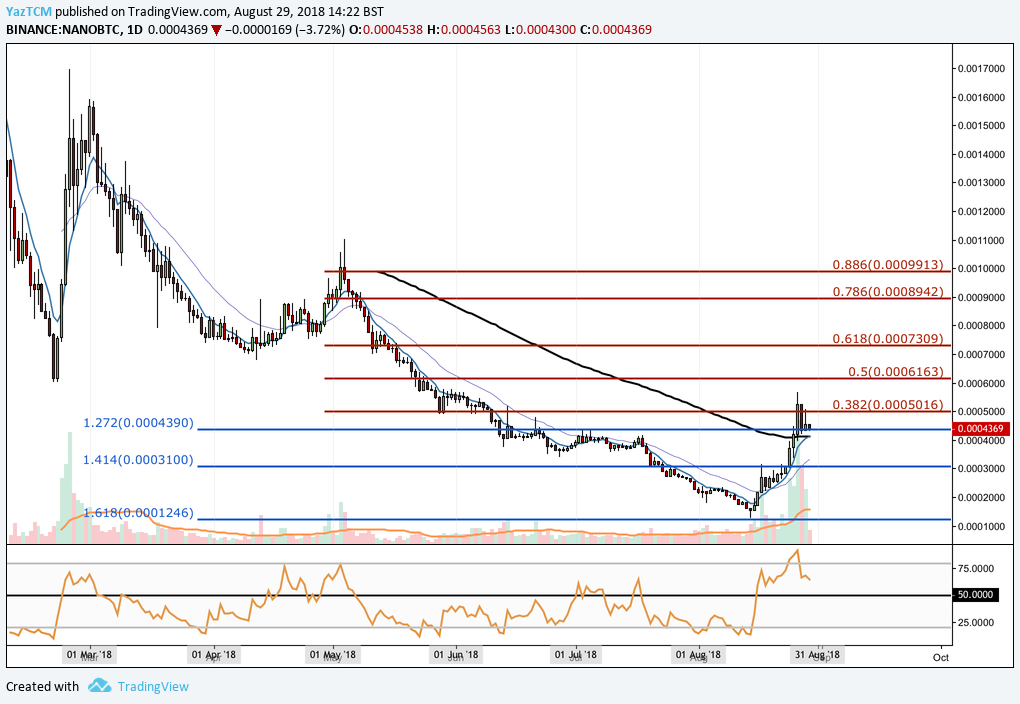
Analyzing the market from the perspective above, we can see that Nano has been consistently falling against BTC throughout the year. It has recently found a strong form of support at a long-term downside 1.618 Fibonacci Extension level priced at 1,246 SATS.
Price action went on to rally from this support level, and is now trading at support marked by the downside 1.272 Fibonacci Extension level priced at 4,390 SATS after overcoming the 100-day moving average.
During the recent rally, we can also see that price action had found strong resistance at a bearish .382 Fibonacci Retracement level priced at 5,016 SATS and rolled over slightly.
If the bullish momentum can continue to push price action above 5,016 SATS once again, we expect immediate resistance to be located at the .5 Fibonacci Retracement level priced at 6,163 SATS, followed by the .618 Fibonacci Retracement level priced at 7,309 SATS.
Alternatively, any bearish pressure is expected the be supported by the downside 1.272 Fibonacci Extension priced at 4,390 SATS, followed by 4,000 SATS, and then finally the downside 1.414 Fibonacci Extension priced at 3,100 SATS.
Related: Is the Future Bright for Nano?