
- NANO/USD has been trading within a symmetrical triangle for the since late August 2018, and is now approaching the apex.
- NANO/BTC has been trapped in a narrow range for the second half of October 2018, stuck between 2,957 SATS and 3,477 SATS.
- Support moving forward: $1.75, $1.50, $1.41, $1.10, $1.00, $0.7440.
- Resistance moving forward: $2.00, $2.30, $2.66, $3.16, $3.48, $4.69, $5.13.
Nano has undergone a 4.30% price raise over the previous 24-hour trading period. The cryptocurrency is presently exchanging at a price around $1.99 on exchanges after NANO/USD had suffered a turbulent 30-day period where the market dropped by over 11%.
Nano is ranked 32nd in market cap rankings with a total market cap value of $262 million. The 20-month old coin has now seen a 90-day period where price action saw an increase totaling 34%.
Nano is now trading at a price that is 94% lower than its all-time high price.
Nano Price Analysis
NANO/USD – LONG TERM – DAILY CHART
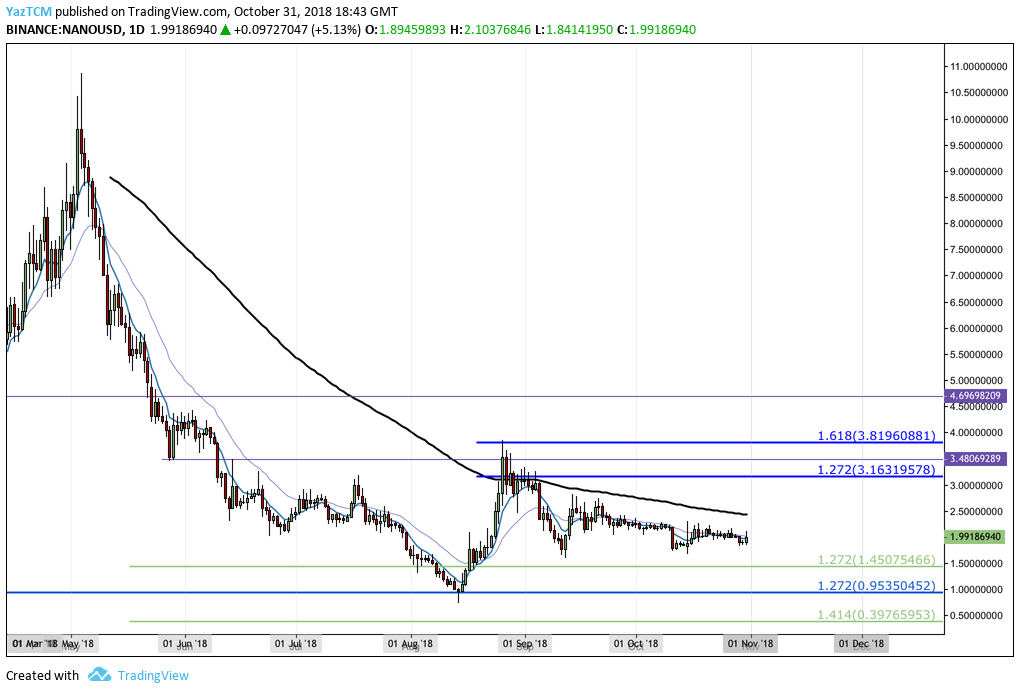
Assessing the market over the long term, we can see that NANO/USD was trapped within an extended downtrend from May 2018 onward.
The downtrend continued until the market reached support at a downside 1.272 Fibonacci Extension level (drawn in blue) priced at $0.9535 during August 2018. This was the only month in which price action managed to break through the psychological support at $1.00.
Price action went on to rebound from this level of support until meeting resistance at a short-term 1.618 Fibonacci Extension level (drawn in dark blue) priced at $3.81 toward the end of August.
Let us continue to analyze price action a little closer over the short term and highlight potential areas of support and resistance moving forward.
NANO/USD – SHORT TERM – DAILY CHART
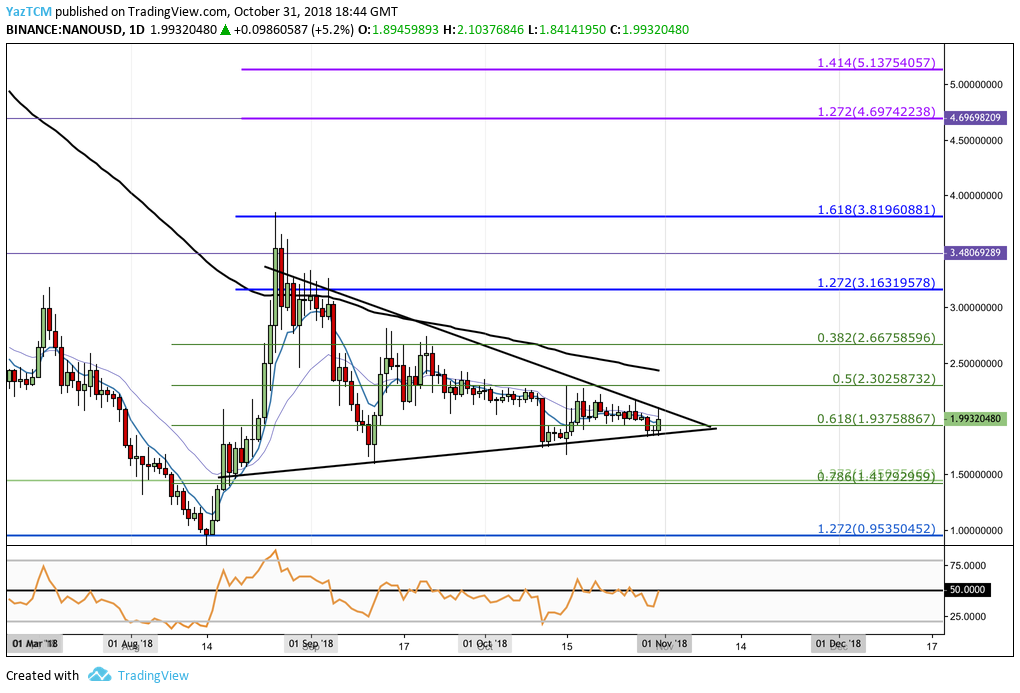
Analyzing the market at a closer timescale, we can clearly see the bullish run which started from a low of $0.7440 on August 14, 2018 and continued to surge to a high of $3.84 on August 26, 2018. This was a price increase which totaled over 400% from low to high.
We can see that after the market rolled over, it began to decline and eventually started to trade sideways.
As the market consolidated, we can see that NANO/USD has been forming a symmetrical triangle pattern in which price action is approaching the apex of. Price action is trading very close to the $2.00 handle as the bulls attempt to break above.
Looking ahead, in our bearish scenario, if the bears manage to pressure the market below the lower boundary of the triangle, we can expect the nearest level of strong support to be located at the short-term .786 Fibonacci Retracement level (drawn in green) priced at $1.41. The .886 Fibonacci Retracement (not charted) is also an area of support beneath, priced around $1.10.
If the bears continue to push the market beneath $1.10, then the next level of support is the psychological round number handle at $1.00, followed by the August 2018 low priced at $0.7440.
Alternatively, on the bullish side, if the bulls can climb above $2.00 and above the upper boundary of the triangle, they will encounter immediate resistance above at the .5 Fibonacci Retracement level priced at $2.30, followed by resistance at the 100-day moving average level which currently floats around the $2.43 handle.
If the bulls then continue to travel higher, they will meet more resistance at the .382 Fibonacci Retracement level priced at $2.66, followed by the short-term 1.272 FIbonacci Extension level (drawn in dark blue) priced at $3.16.
Moving further forward, if the bulls can break above the $4.00 handle, higher resistance above here can be located at the 1.272 and 1.414 Fibonacci Extension levels (drawn in purple), priced at $4.69 and $5.13 respectively.
It is important to understand that if there is no significant market volume and momentum upon the breakout of the triangle, to either side, then the market will likely continue to trade sideways. This will allow us to re-adjust the boundaries of the triangle.
The RSI is trading directly on the 50 handle, indicating the indecision between buyers and sellers. If we would like to a see a positive breakout of the triangle, we would need to see the RSI break above the 50 handle. This would indicate that the bulls are in possession of the market momentum.
Let us continue to analyze price action for NANO relative to BTC over the long term.
NANO/BTC – LONG TERM – DAILY CHART
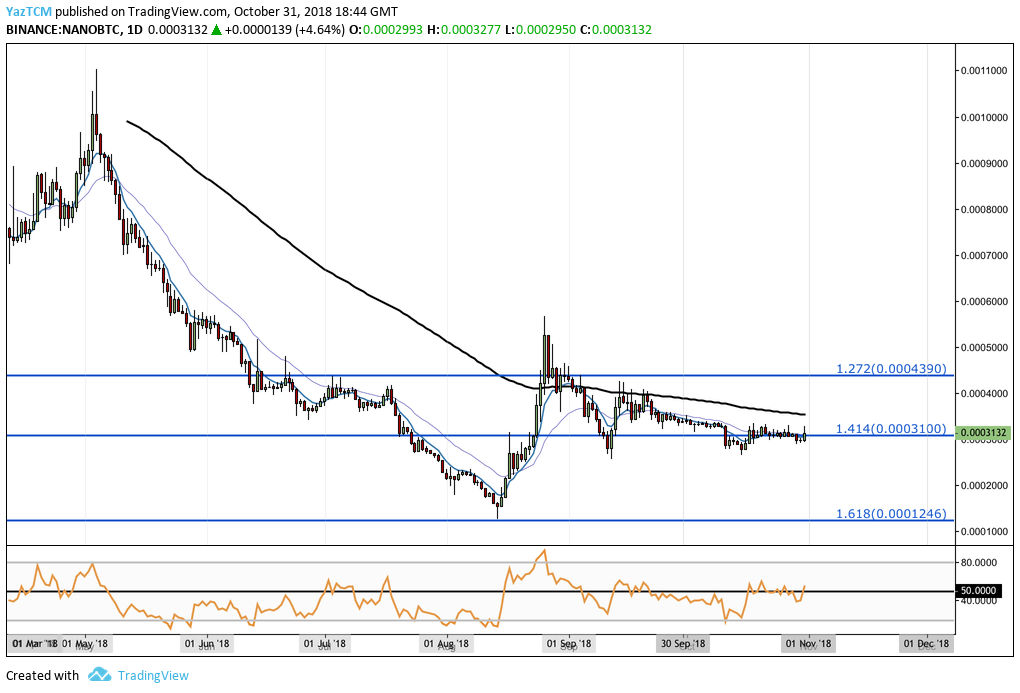
Analyzing NANO/BTC from the long-term outlook above, we immediately notice the similar market dynamics with NANO/USD.
We can see that the market was predominantly bearish from May 2018 onward, until support was found in August 2018 at a downside 1.618 FIbonacci Extension level priced at 1246 SATS.
At this level of support, the buyers stepped back into the market, causing NANO/BTC to rally higher.
Let us continue to analzse NANO/BTC a little closer over the short term and highlight any potential support and resistance zones.
NANO/BTC – SHORT TERM – DAILY CHART
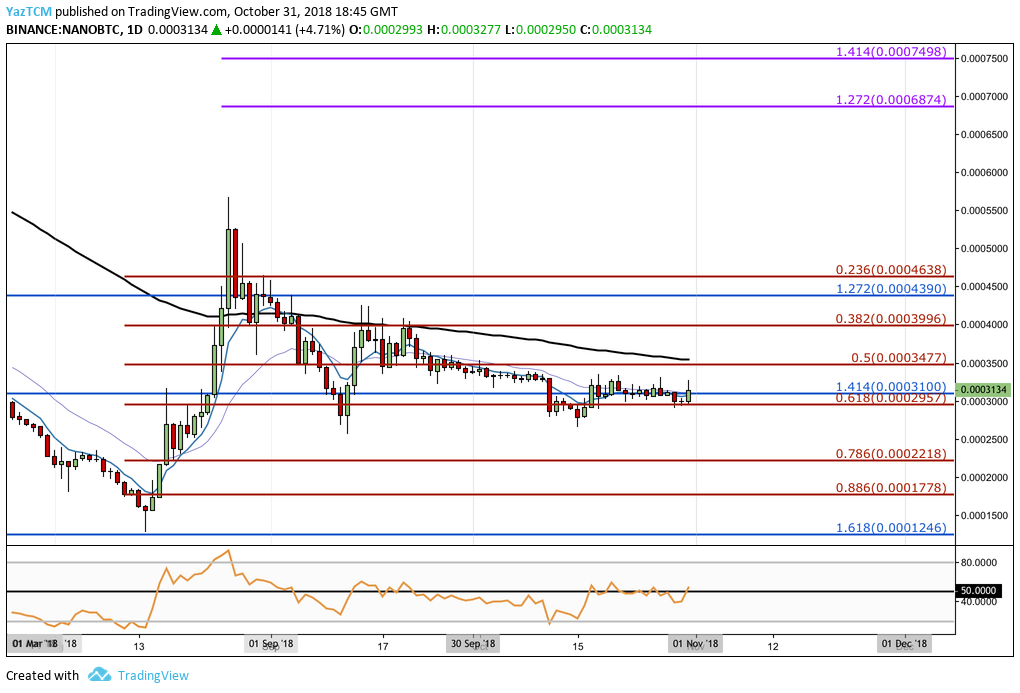
Taking a look at the market from a closer perspective, we can see the price surge starting from a low of 1,270 SATS on August 14, 2018 and extending to a high of 5,670 SATS on August 24, 2018, creating a total price rise of over 340%.
The market then rolled over and declined, until finding support marginally beneath the short-term .618 Fibonacci Retracement level priced at 2,957 SATS during September 2018.
We can also notice that for the last half of October 2018, price action has been trapped in a range between the .5 and .618 Fibonacci Retracement levels, priced at 3,447 SATS and 2,957 SATS. This range is also further confirmed with the RSI trading directly around the 50 handle during the same period. This indicates that the bulls and the bears are battling for possession of market momentum.
Moving forward, if the sellers manage to penetrate below the support at 2,957 SATS, we can look for immediate support below at the .786 and .886 Fibonacci Retracement levels, priced at 2,218 SATS and 1,778 SATS respectively. If the bearish momentum continues even lower to penetrate below 1,500 SATS, we can look for more support below at the August 2018 low, priced at 1,270 SATS.
Alternatively, in our bullish scenario, if the buyers can begin to overpower the sellers and push the market higher, they will meet significant resistance at the top of the range, which is priced at 3,447 SATS. This area of resistance will require a surge of momentum to climb above due to the 100-day moving average being closely located within the same area. This further adds to the strength of the expected resistance.
If the bulls can then continue to climb above the 100-day moving average, they will meet further resistance above at the .382 and .236 Fibonacci Retracement levels, priced at 3,996 SATS and 4,638 SATS respectively.
Looking even further ahead, if the buyers can penetrate above the August 2018 high at 5,760 SATS, we can expect higher resistance then at the 1.272 and 1.414 Fibonacci Extnesion levels, (drawn in purple) priced at 6,874 SATS and 7,498 SATS respectively.