
Monero, like the rest of the crypto market, has suffered a significant loss totaling 11% over the past 24 hours of trading. The cryptocurrency is currently exchanging hands at $102.49, and has suffered a drastic 17% drop over the past 7 trading days.
Monero was designed to be a secure, anonymous and private cryptocurrency. Launched in April 2014, Monero was based off the CryptoNote codebase, different from the codebase used by Bitcoin.
Typical blockchain cryptocurrencies are public ledgers that keep track of all transactions made on the network. This means that with some blockchain forensics, a transaction can usually be traced back to its owner and the total transaction amounts are always visible.
Monero has overcome this privacy issue by implementing ring signature cryptography. This technology mixes a user’s account key with public keys from the Monero blockchain to create a ring of possible signers of the transactions. This way, anybody looking at the transaction from the outside cannot identify which key is the one that was used to sign the transaction.
Monero is currently ranked 13th in terms of overall market cap across the entire industry. It currently has a total market value of $1.67 billion, and has suffered a 26% price loss of the past 30 trading days.
Let us continue to analyze price action for Monero over the long term.
Price Analysis
XMR/USD – LONG TERM – DAILY CHART
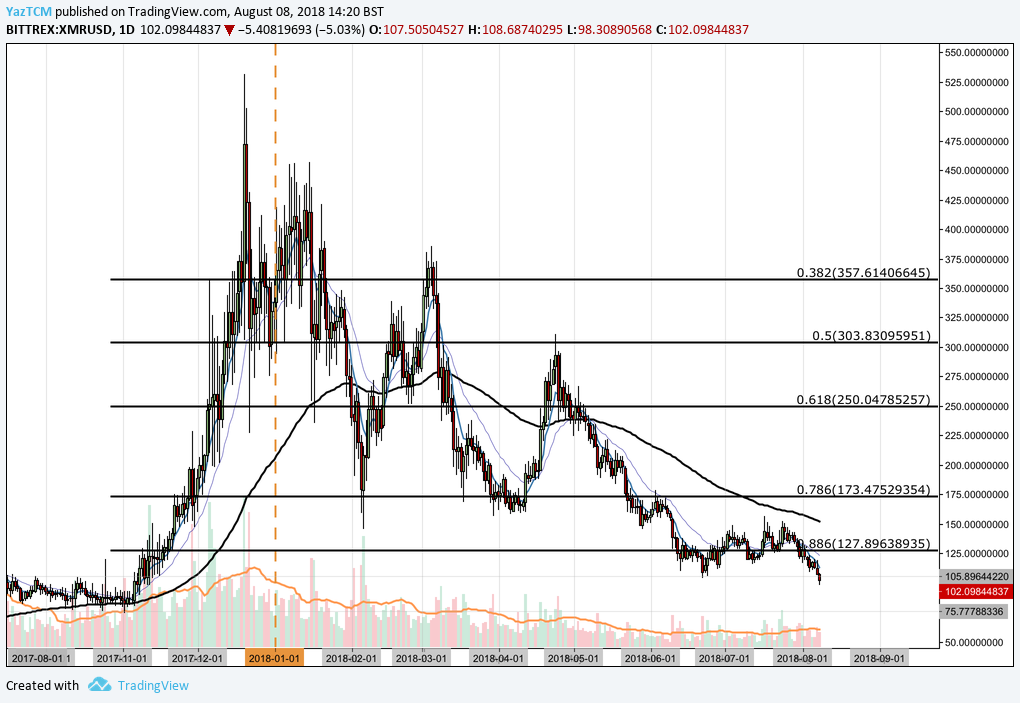
Analyzing the market from the long-term perspective above, we can see that Monero had experienced a significant bullish run as price action started from a low of $74.77 on November 2, 2017 and extended to an all-time high of $531.27 on December 20, 2017. This was a price increase totaling 585% from low to high.
We can see that after placing this all-time high, price action went on to decline, initially finding a solid foundational support at the .5 Fibonacci Retracement priced at $303.83 during January. This is a Fibonacci Retracement measured from the entire bullish run aforementioned.
However, as February started to trade, the market was not able to sustain itself above $300 and fell below the 100-day moving average, until support was found at the .786 Fibonacci Retracement priced at $173.47.
For the following 3 months, this .786 Fibonacci Retracement had provided ample support as the bulls defended this level each time the market would approach it. However, during June, price action slipped further, finding support below the .886 Fibonacci Retracement priced at $127.89. We can see that price action had found support at $105.89 which correlated with the highs seen during October 2017.
Over the past 2 trading days, price action has fallen further below this level to create fresh yearly lows within the market as the bulls brace themselves to defend the $100 price level with all their might.
Let us continue to analyze price action a little closer over the more recent period to highlight any potential support and resistance zones.
XMR/USD – SHORT TERM – DAILY CHART
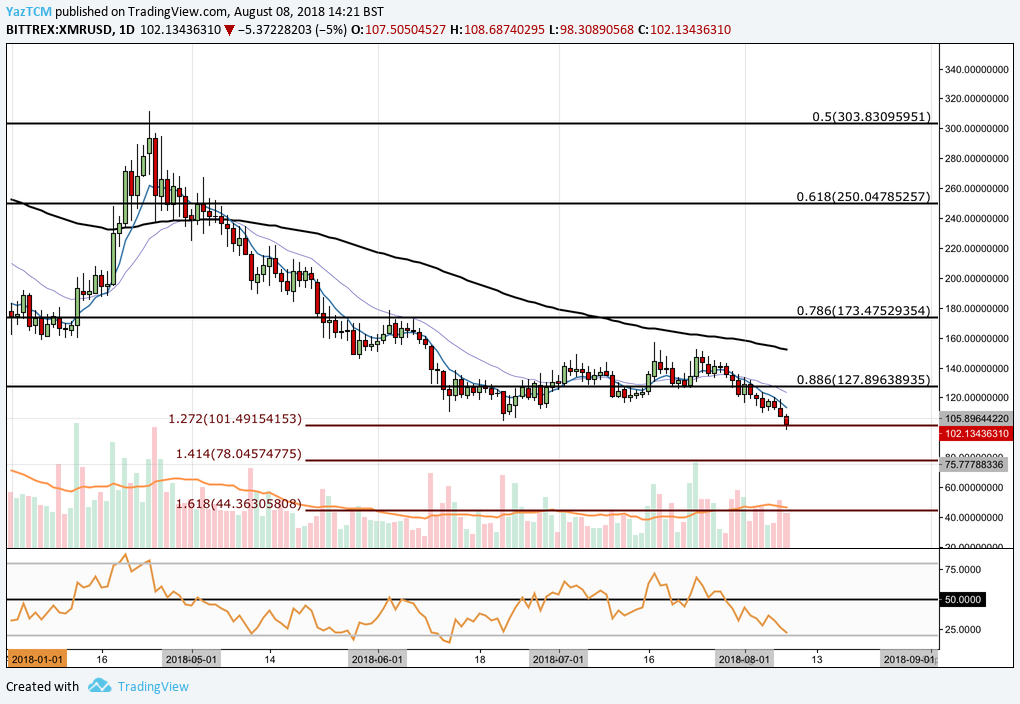
Analyzing the market from a shorter perspective, we can see that the market has reached support at a short-term downside 1.272 Fibonacci Extension priced at $101.49. This Fibonacci Retracement is measured from the entire bearish swing leg from the high seen during April to the low witnessed during May.
This 1.272 Fibonacci Extension marks a crucial zone within the market. A break below this level is likely to take the market below the Schelling point, psychological handle, of $100. A break below $100 could cause the hands of remaining investors to shake, leading to further capitulation.
In the scenario that the market does break below the downside 1.272 Fibonacci Extension level, we expect immediate support to be located at the 1.414 Fibonacci Extension priced at $78.04. This area of support strongly correlates with the price lows witnessed during October 2017 and therefore should add to the support expected here. Further support below this handle is expected at the 1.618 FIbonacci Extension priced at $44.36.
Alternatively, if the bulls can gather enough momentum from this price area we expect immediate resistance to be located at the the .886 Fibonacci Retracement, once again, priced at $127. Further significant resistance above this area will be expected at the 100-day moving average which is currently hovering around the $150 level. The market has not overcome the 100-day moving average since late April and therefore significant momentum will be required to overcome this level.
As the market is in a heavy downtrend, the technical indicators are heavily favoring the bears at this current moment in time. The RSI indicator is trading at extreme oversold conditions at the 20 handle, signaling that bearish momentum is in complete control. For a sign that the bearish momentum is easing, we will look for the RSI to make its way back toward the 50 handle.
Let us continue to analyze price action for XMR relative to BTC over the long term.
XMR/BTC – LONG TERM – DAILY CHART
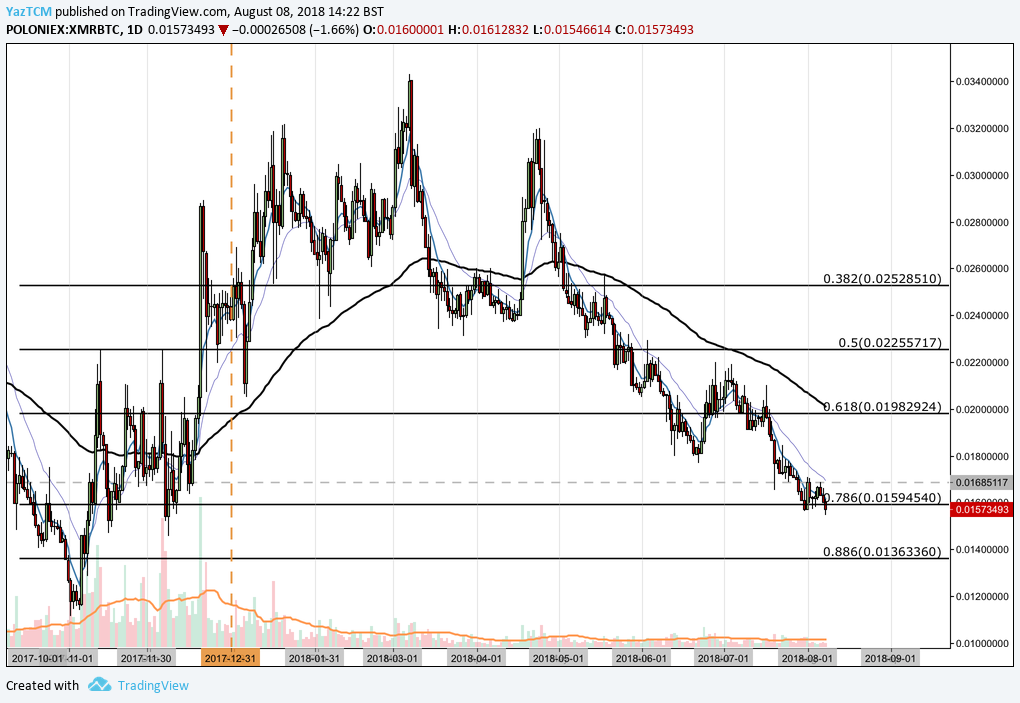
Analyzing the market for Monero against Bitcoin, we can see that XMR had experienced a significant price run when the market started from a low of 0.01152 BTC on November 2, 2017 and extended to a high of 0.034398 BTC on March 7, 2018. This was a price increase totaling 210% from low to high.
We can see that the market was not able to sustain this price run and proceeded to roll over during May, as price action fell below the 100-day moving average and continued to fall until support was found at the .786 Fibonacci Retracement priced at 0.0159 BTC, where it is currently trading now.
Let us continue to analyze price action a little closer to highlight any potential support and resistance zones.
XMR/BTC – SHORT TERM – DAILY CHART
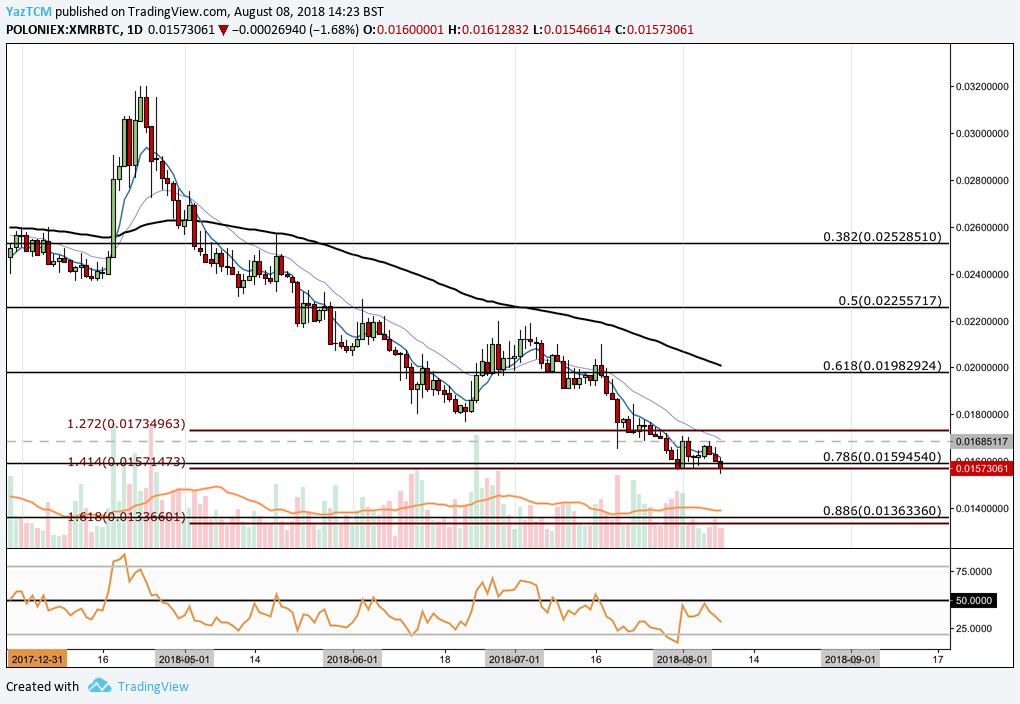
Analyzing the market from a short-term perspective, we can see that the support that the market had found at the .786 Fibonacci Retracement was also bolstered by a downside short-term 1.414 Fibonacci Extension which is priced in the same area.
We can see that the market has been trading, over the past week, between a range bound between the 1.414 Fibonacci Extension and the 1.272 Fibonacci Extension priced at 0.01734.
Price action is currently trading at the yearly low price for XMR Against BTC. If the bearish pressure continues, we expect the market to continue to fall lower until meeting further support at the long-term .886 Fibonacci Retracement level priced at 0.013633 BTC.
Alternatively, near-term resistance is expected at the upper boundary of the current range, marked by the 1.272 Fibonacci Extension priced at 0.01734 BTC.
A break above this level could signal a potential short-term bullish run as to which initial resistance would be located at the .618 Fibonacci Retracement, priced at 0.01982 BTC. This area of resistance will require significant momentum to overcome as the 100-day moving average is closely located within this area also.
The technical indicators are, once again, favoring the bears within the market. However, if the RSI can break above the 50 handle, this would signal that the bullish pressure is building within the market and could cause the market to break above the upper boundary of the range.
Related: Monero 2018 Roadmap: The Future of Private Digital Currency Looks Bright