
MonaCoin has seen an impressive 37% price increase over the past 24 hours of trading. The cryptocurrency is currently exchanging hands at a price of $1.26 after seeing a 31% price increase over the past 7 trading days.
MonaCoin is perhaps one of the only cryptocurrencies that is still centralized within one country. Created in Japan in December 2013, MonaCoin has been touted as “the first Japanese Cryptocurrency.”
It was released by the pseudonym Mr.Wathanabe on the Japanese website 2chan, and was created to become a direct competitor to Bitcoin, offering faster transaction speeds and lower fees. MonaCoin was a fork of Litecoin, and the developers have recently implemented SegWit and activated the Lightning Network, making it up-to-date with the latest technologies in blockchain.
The name for Mona was taken from the ASIC II cat emoji drawn character. It was originally intended to be a meme coin, but has since gained significant traction inside Japan.
MonaCoin is currently ranked 78th in terms of overall market cap across the entire industry. It has a total market cap value of $78 million after the 54-month old coin suffered a 45% price decline over the past 90 trading days. MonaCoin is still currently trading at a price that is 93% lower than its all-time high price.
Let us continue to analyze price action for MONA over the long term.
MonaCoin Price Analysis
MONA/USD – LONG TERM – DAILY CHART
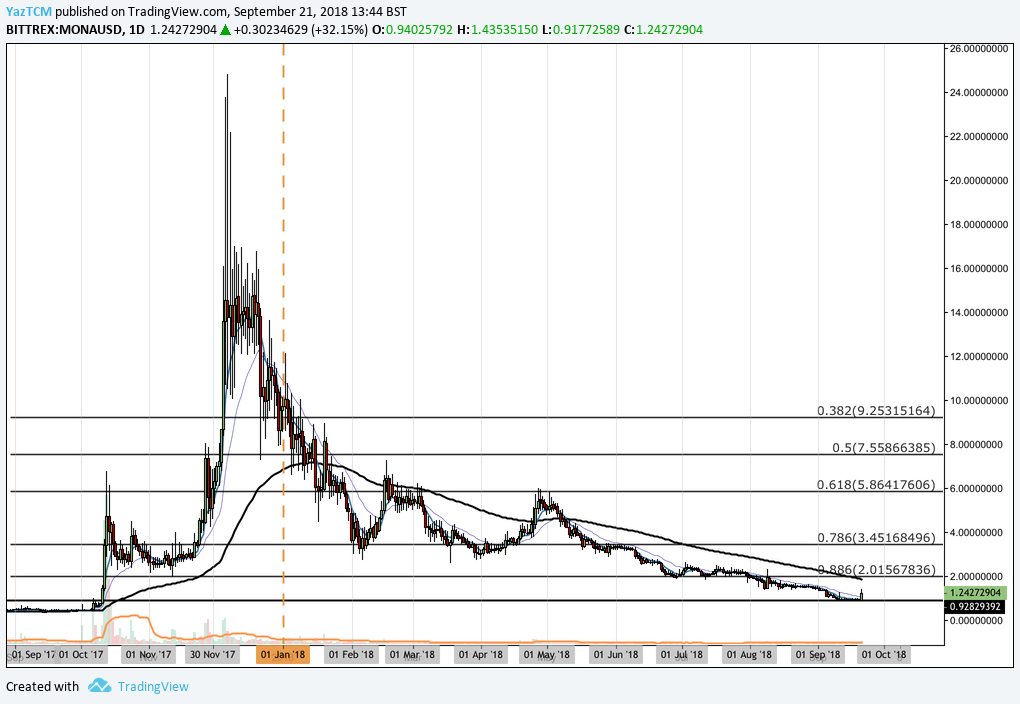
Analyzing the market from the long-term perspective above, we can see that MonaCoin had experienced a significant bullish run during 2017. Price action started from a low of $0.4542 on October 6, 2017 and extended to an all-time high price of $24.83 on December 7, 2017. This was a price increase totaling 3,400% from low to high.
We can see that after placing the all-time high, price action rolled over and declined aggressively. It had originally found support at the .618 FIbonacci Retracement level priced at $5.86 during January 2018. This Fibonacci Retracement level was measured from the entire bullish run outlined above.
Price action continued to fall as the year progressed as the market found further support at the .786 Fibonacci Retracement level priced at $3.45 during February 2018. We can see that this price level held for over 4 months, keeping the market above the support level.
However, during June 2018, price action fell below this support level and continued to fall further until finding support at the .886 Fibonacci Retracement level priced at $2.01.
The support at $2.01 was short-lived as the market fell lower during August 2018 to find support at where the market has recently rebounded from around the $0.92 handle. We can see that this price level had provided significant resistance for the market during the early stages of October 2017.
Let us continue to analyze the market at a shorter time frame and highlight any potential support and resistance levels.
MONA/USD – SHORT TERM – DAILY CHART
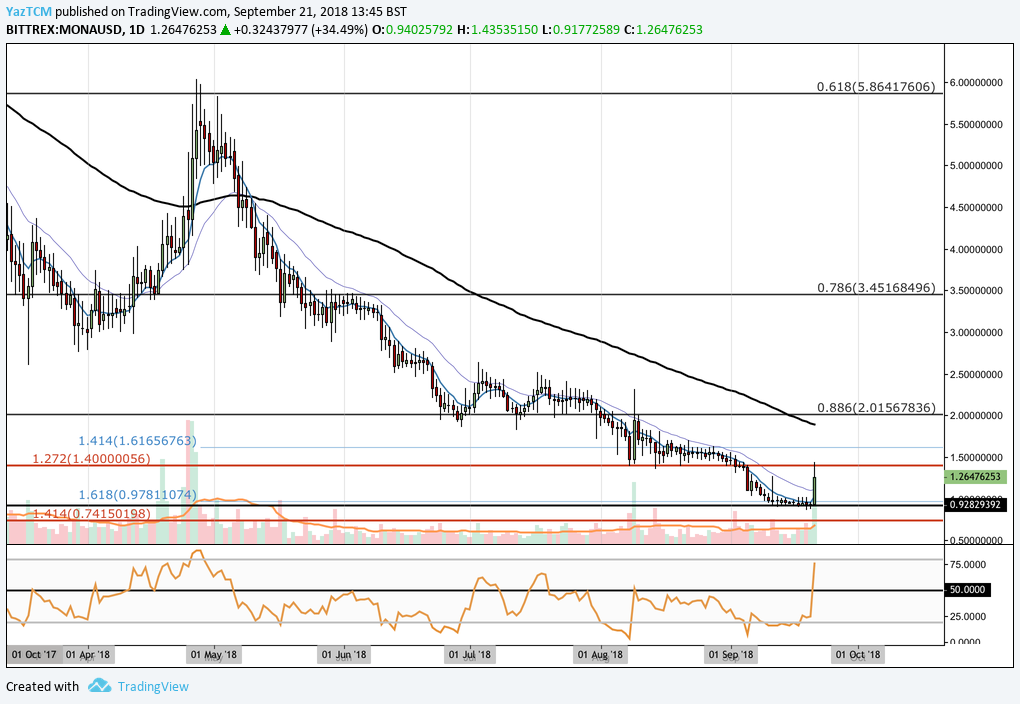
Analyzing the market from the short-term perspective above, we can see that the support at the $0.92 handle was further reinforced by a short-term downside 1.618 Fibonacci Extension level (drawn in blue) priced at $0.9781. Price action has recently rebounded from this support level aggressively, producing a 37% gain.
We can see that the market rallied until price action found resistance at the downside 1.272 Fibonacci Extension level (drawn in red) priced at $1.40. The market has now established a trading range throughout September 2018 with the $1.40 handle as the upper boundary and the $0.92 handle as the lower boundary.
Moving forward, if the bullish price action continues and manages to penetrate above the upper boundary of the trading range, we expect immediate further resistance to be located at the previous downside 1.414 Fibonacci Extension level (drawn in blue) priced at $1.61.
Further resistance above this level can then be expected at the 100-day moving average which currently is hovering around the $1.90 handle, followed by the psychological round number resistance provided by the $2.00 handle. This price area also contains the .886 Fibonacci Retracement level, further adding to the expected resistance in this area.
If the bulls can continue even higher, then further resistance can then be located at the .786 Fibonacci Retracement level priced at $3.45.
Alternatively, if the bears regain control of the momentum within the market and push price action lower, we expect immediate momentum to be located at the lower boundary of the trading range priced at $0.92. If the bearish action pushes price below this level of support, further support can be located at the downside 1.414 Fibonacci Extension level (drawn in red) priced at $0.74.
The technical indicators within the market are currently heavily leaning toward the bulls. The RSI is trading well above the 50 handle, trading near overbought conditions which indicate that the bulls are in complete control of the momentum within the market.
Let us continue to quickly analyze price action for Mona relative to BTC over the long term.
MONA/BTC – LONG TERM – DAILY CHART
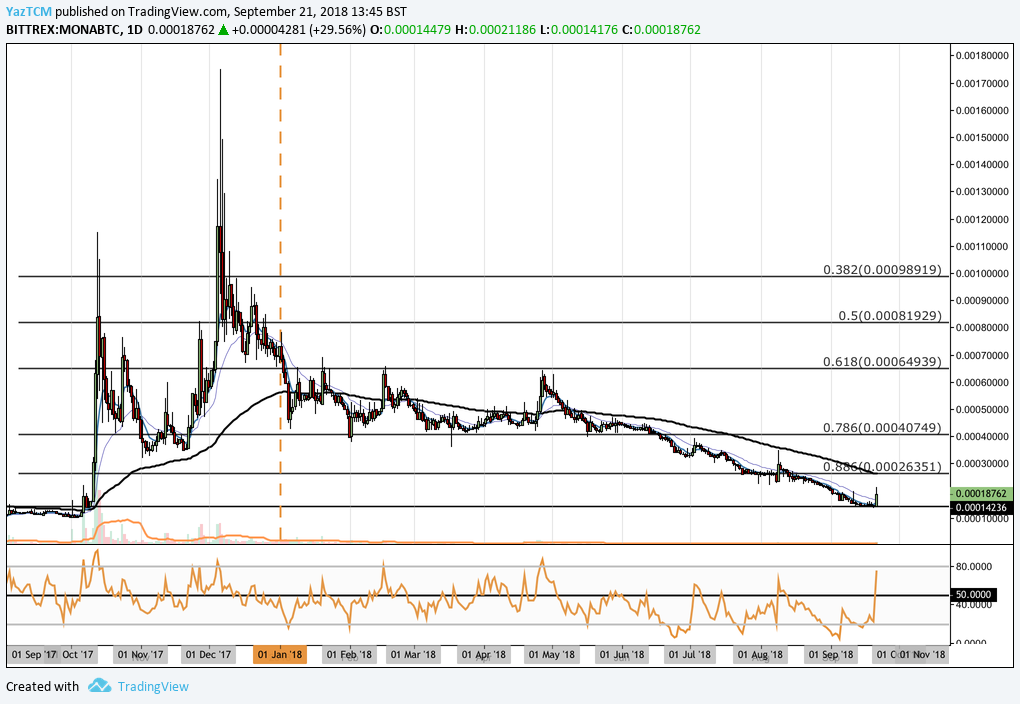
Analyzing the market from the long-term perspective above, we can see that Mona had experienced a bullish run relative to BTC during 2017. Price action started from a low of 10,608 SATS on October 6, 2017 and extended to a high of 175,000 on December 6, 2018. This was a price increase totaling over 1,500% from low to high.
We can see that after reaching the all-time high, price action rolled over and began to decline rapidly. We can see that it managed to find support at the .786 Fibonacci Retracement level priced at 40,749 SATS in January 2018. This Fibonacci Retracement is measured from the entire bullish run outlined above.
The market had held at this support level for the majority of the trading year. However, during June 2018, the market slipped below the 40,749 SATS handle and continued to fall, until finding support at the .886 Fibonacci Retracement level priced at 26,351 SATS in July 2018.
Price action continued to fall even further lower until it had found further support at the 14,236 SATS handle, where it has recently rebounded aggressively.
Moving forward, if the bullish momentum continues within the market, we expect the nearest level of resistance to be located the .886 Fibonacci Retracement level priced at 26,351 SATS. This area of resistance is significantly bolstered by the 100-day moving average which is currently trading at the same price level.
The technical indicators within the market have recently swung toward the bulls’ favor as the RSI rockets above the 50 handle. If the RSI can remain above the 50 handle, we can expect the market to continue to make further gains.