
- MaidSafe has seen a respectable price increase totaling over 35% over the past 30 trading days.
- The market has recently met resistance at a short-term 1.272 Fibonacci Extension level priced at $0.2631.
- Support levels moving forward: $0.2438, $0.2306, $0.2200, $0.2094, $0.1942, $0.1761
- Resistance levels moving forward: $0.2631, $0.2794, $0.2870, $0.30, $0.3206.
MaidSafe has seen a small 1.40% price gain over the last 24 hours of trading. The MAID cryptocurrency is now trading at a price of $0.2665, at the time of writing, after undergoing a further 13.16% price boost over the previous 7 trading days.
The MaidSafe project is now ranked in 60th position in market cap rankings and holds a $116 million market cap value. The 55-month old cryptocurrency has experienced an impressive price surge totaling 35% over the last 30 trading days. It now trades at a value that is 77% lower than its all-time high price.
Let us continue to analyze MAID/USD over the medium term and assess the market’s behavior.
MaidSafe Price Analysis
MAID/USD – MEDIUM TERM – DAILY CHART
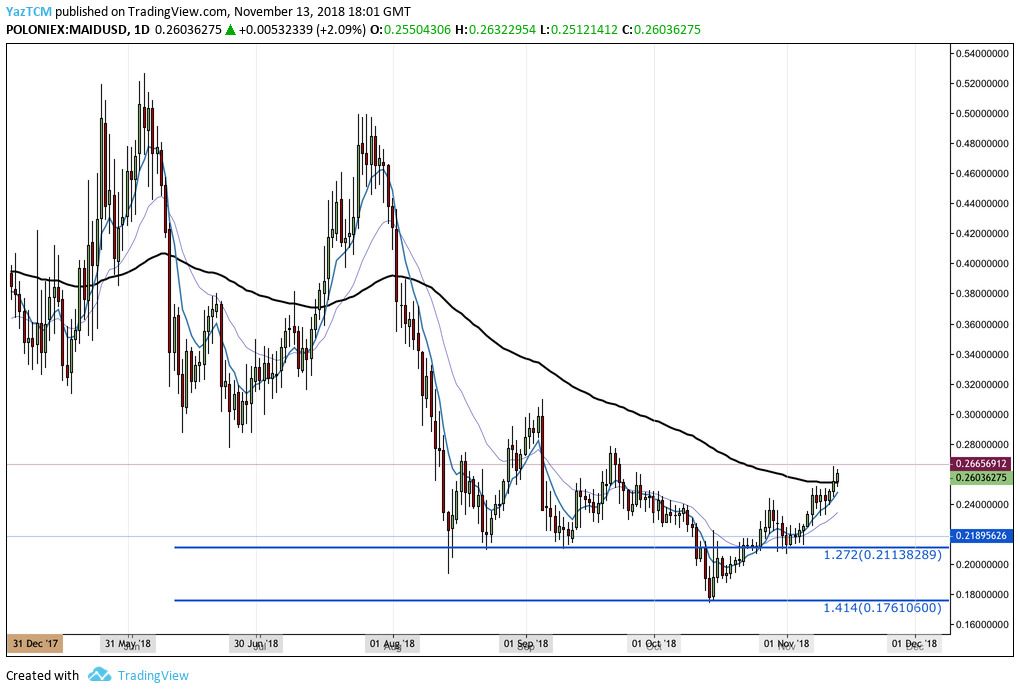
From the long-term perspective above, we can see that the majority of Q2 and Q3 2018 was a depressing period for MAID/USD. Price action had fallen from a high above $0.52 in June 2018 and was below $0.25 by August 2018.
As shown in the chart above, the downtrend came to a halt as MAID/USD had reached support at the downside 1.414 FIbonacci Extension level priced at $0.1710 during October 2018. As price action reached this support level, the buyers re-entered the market and caused the downtrend to reverse.
Price action has continued to rise and has recently managed to climb above resistance at the 100-day moving average level.
Let us continue to analyze price action a little closer over the short term and outline our possible bullish and bearish scenarios.
MAID/USD – SHORT TERM – DAILY CHART
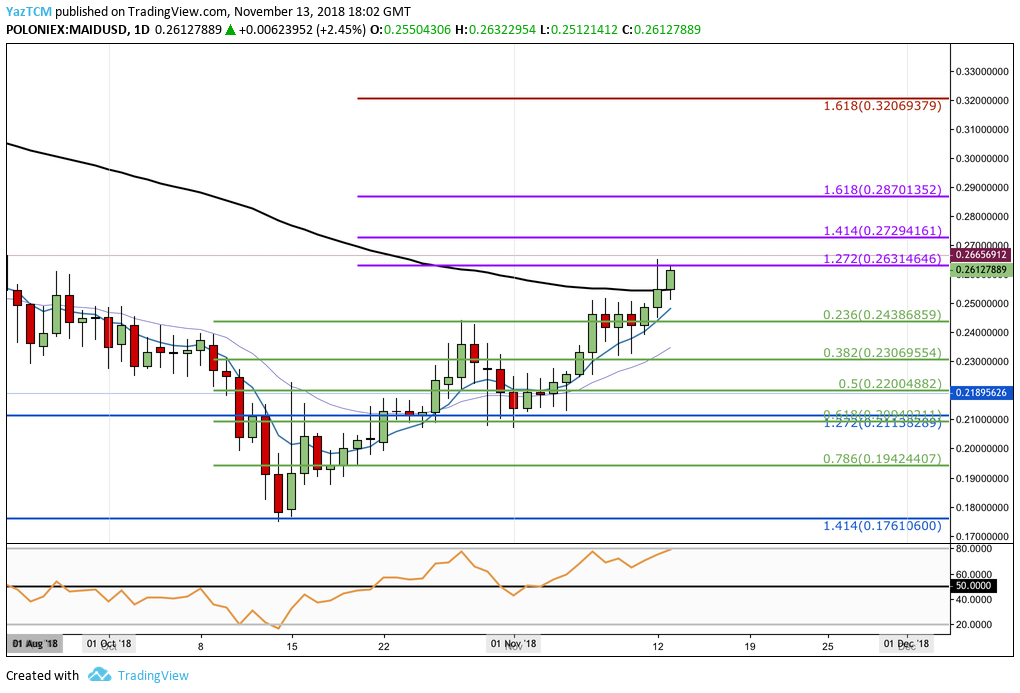
Analyzing price action from the short-term chart above, we can see that as MAID/USD reversed at the highlighted support level, it went on to surge from a low of $0.1745 on October 14, 2018 to a high of $0.2650 recently on November 12, 2018.
We can see that as price action had placed the high, it had reached resistance provided by a short-term 1.272 Fibonacci Extension level (drawn in purple) priced at $0.2631. This is where the market is currently trading, at the time of writing.
Looking ahead, if the bulls can continue with their ascension and penetrate above the resistance at $0.26, then we can expect further immediate resistance above to be located at the short-term 1.414 and 1.618 Fibonacci Extension levels (drawn in purple), priced at $0.2729 and $0.2870 respectively.
If the buyers continue progressing higher, further resistance above can be located at the psychological round number handle at $0.30, followed by the longer-term 1.618 Fibonacci Extension level (drawn in red) priced at $0.3206.
Alternatively, in our bearish scenario, if the sellers regroup and start to pressure the market lower, we could see MAID/USD retracing initially toward the short-term .236 and .382 Fibonacci Retracement levels (drawn in green), priced at $0.2538 and $0.2306 respectively.
If the bearish momentum continues to push price action further lower, more support can be expected at the .5 and .618 Fibonacci Retracement levels (drawn in green), priced at $0.2200 and $0.2094 respectively. The support at $0.2094 is further reinforced by the previous downside 1.272 FIbonacci Extension level (drawn in blue) priced slightly higher at $0.21.
If the sellers can breakthrough the $0.20 handle, the last 2 levels of support beneath to highlight are located at the .786 Fibonacci Retracement level (drawn in green) priced at $0.1942, followed by the downside 1.414 Fibonacci Extension level (drawn in blue) priced at $0.1761.
The RSI is trading well above the 50 handle at overbought conditions which indicates that the market may need to retrace slightly before being able to advance further higher. As the market starts to drop, if the RSI can remain above the 50 handle, this would indicate that the bears have still not taken control of the market momentum.
Let us continue to quickly analzse price action for MAID against BTC over the medium term.
MAID/BTC – MEDIUM TERM – DAILY CHART
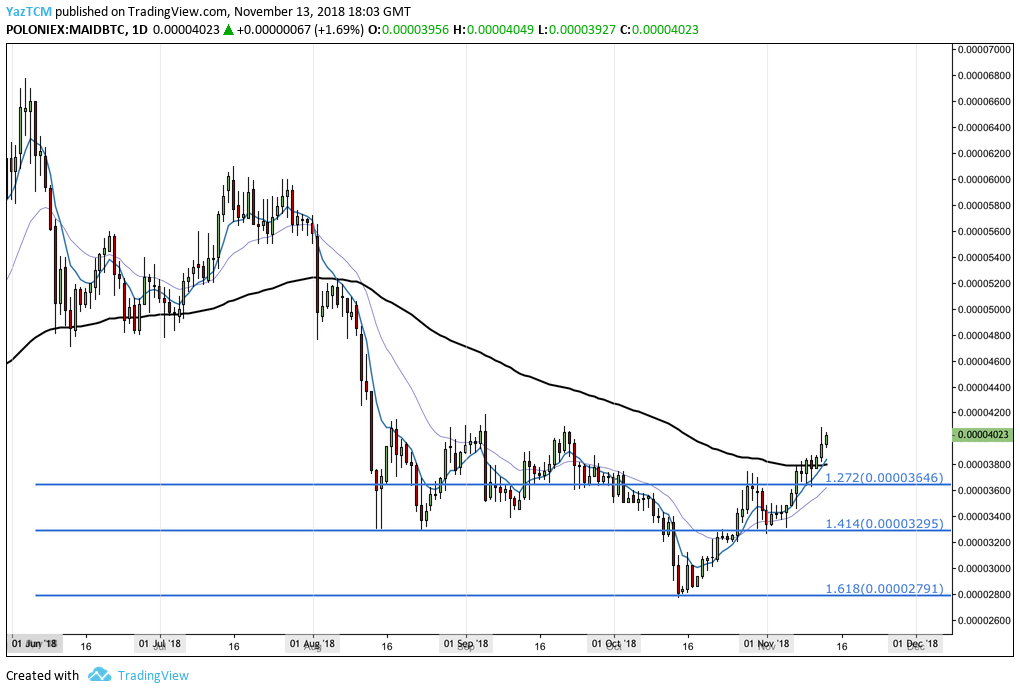
MAID/BTC over the long term tells a similar story to that of MAID/USD over the long term. The market had been consistently falling throughout the year until finding support at the downside 1.618 Fibonacci Extension level priced at 2,791 SATS during October 2018.
After MAID/BTC reached this area, the downtrend reversed and price action commenced to surge.
Let us continue to take a closer look at the recent price surge and highlight any areas of potential support and resistance.
MAID/BTC – SHORT TERM – DAILY CHART
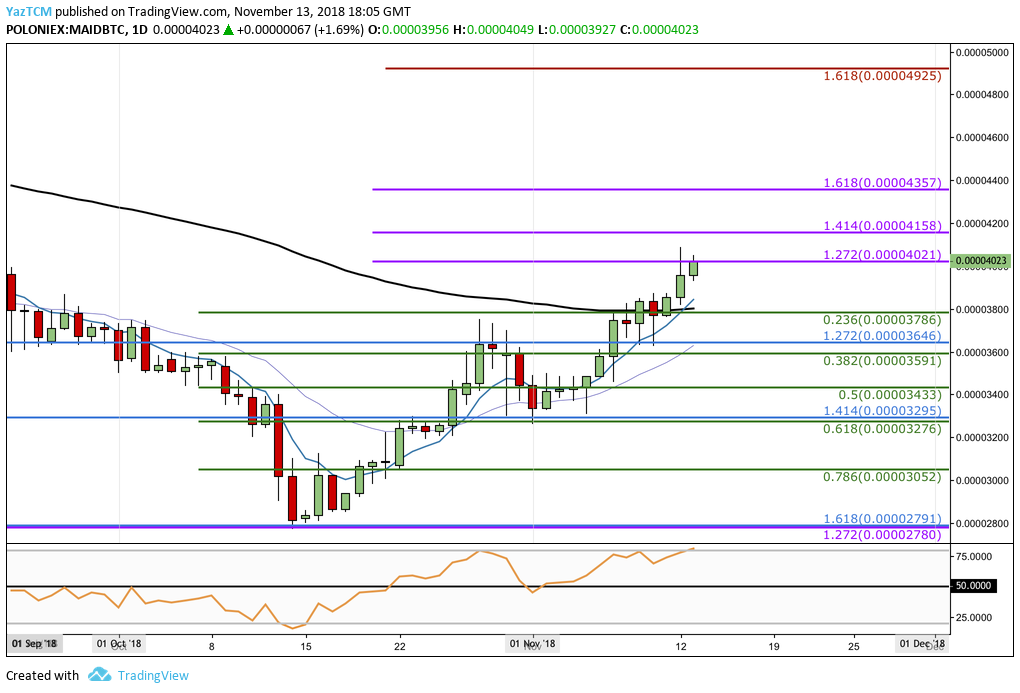
Examining the chart above, we can see that the recent price surge had caused price action for MAID/BTC to increase by over 45%. The surge began at a low of 2,770 SATS on October 14, 2018 and rose to a high of 4,090 SATS on November 12, 2018.
The market had reached resistance at the short-term 1.272 Fibonacci Extension level (drawn in purple) priced at 4,021 SATS before the price rise stalled.
Moving forward, if the buyers can continue to climb above the resistance at 4,021 SATS, we can expect immediate resistance above to be located at the 1.414 and 1.618 Fibonacci Extension levels (drawn in purple), priced at 4,158 SATS and 4,357 SATS respectively.
If the bullish momentum persists to drive the market even higher, we can expect more resistance above to be located at the long-term 1.618 Fibonacci Extension level (drawn in red) priced at 4,925 SATS.
Alternatively, in our bearish scenario, if the market rolls over and begins to retrace, we can expect immediate significant support below to be located at the short-term .236 Fibonacci Retracement level (drawn in green) priced at 3,786 SATS. This area of support is significantly bolstered by the 100-day moving average which presently is hovering around the same price range.
If the sellers continue to drive MAID/BTC further lower, more support beneath can then be expected at the .382 and .5 Fibonacci Retracement levels, priced at 3,591 SATS and 3,433 SATS respectively. Further support beneath this level can be expected at the .618 and .786 Fibonacci Retracement levels, priced at 3,276 SATS and 3,052 SATS respectively.
The RSI is also trading at overbought conditions within this market which signals that the market may need to retrace slightly before being able to rise higher.