
- The bulls within Lisk is currently involved in a battle to bring price action back above $1.50.
- The LSK/USD market has found strong support at $1.40 as LSK/BTC remains within a trading range, with 32,309 SATS marking the bottom of the range.
- Support moving forward: $1.40, $1.30, $1.20, $1.10, $1.00, $0.8803.
- Resistance moving forward: $1.56, $1.75, $1.90, $2.00, $2.25, $2.61, $2.82, $3.00.
Lisk has seen a small price decline totaling 1.92% over the last 24-hour trading session, bringing the current trading price to $1.47.
After a troubling 30-day period where price action plummeted by over 47%, the market has shown some signs of a recovery over the past 7 trading days as it experiences a 12.70% price hike.
The Lisk project is now ranked in 34th position, with a total market value of $164 million. The 32-month old project has lost a further 68% over the past 3 months, and is now trading at a value that is over 95% lower than the all-time high price of $41.39.
Let us proceed to take a look at the LSK/USD market over the long term and assess the market behavior over the trading year.
Lisk Price Analysis
LSK/USD – LONG TERM – DAILY CHART
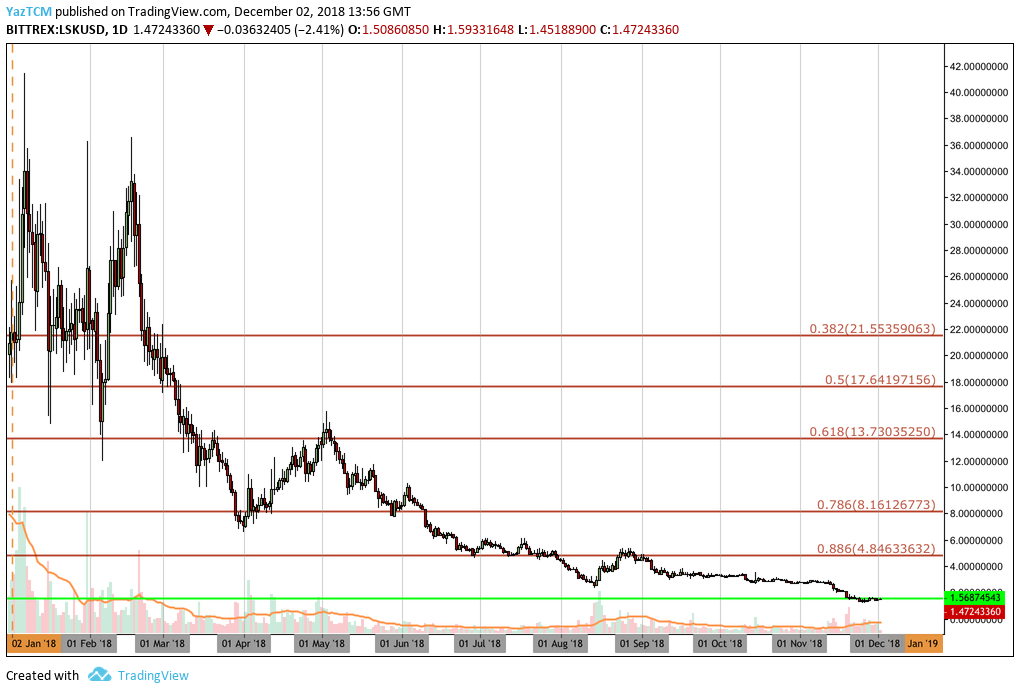
From the long-term outlook above, we can see that LSK/USD has experienced a year of consistent decline over the trading year of 2018.
The market has continuously capitulated over the year and has recently achieved fresh price lows which have not been visited for over the past 16 months.
The market has began to stall around the $1.50 region as buyers scramble to prevent price action from dipping further below.
Let us continue to take a look at LSK/USD from a closer perspective and highlight any potential areas of support and resistance moving forward.
LSK/USD – SHORT TERM – DAILY CHART
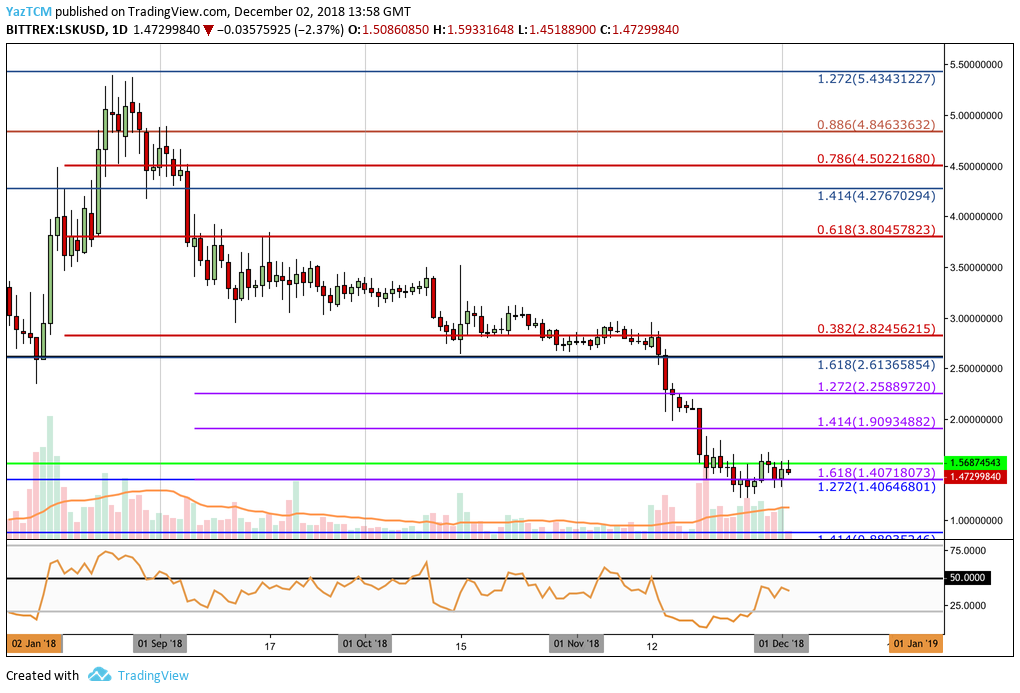
Analyzing the market from the previous 3 months, we can immediately see the aftermath of the November 2018 crypto bloodbath which saw LSK/USD plummet below $2.00 to where it is presently trading around $1.47.
The market has recently reached a combined area of support around the $1.40 handle, provided by a long-term downside 1.272 Fibonacci Extension level (drawn in blue) and a shorter-term downside 1.618 Fibonacci Extension level (drawn in purple), both priced in the same area.
The bulls are battling at this support level to prevent price action from dipping further below but they are also failing to make any progression higher as they are turned away at resistance around the $1.56 handle.
Moving forward, if the buyers can achieve success in climbing above the $1.56 resistance level and continue higher, we can expect initial higher resistance above to be located at the previous short-term downside 1.414 Fibonacci Extension level (drawn in purple) priced at $1.90, followed immediately by the $2.00 handle.
If the bullish momentum persists higher above $2.00, more resistance will then be located at the short-term downside 1.272 Fibonacci Extension level (drawn in purple) priced at $2.25, followed by the long-term downside 1.618 Fibonacci Extension level (drawn in dark blue) priced at $2.61.
If the bulls continue upward above $2.61, then the next level of significant resistance will be located at the $3.00 handle.
On the other hand, in our bearish scenario, if the sellers regroup and begin pushing price action lower again, we can expect immediate support below to be located at the aforementioned combined support level at the $1.40 handle. Support below this can then be located at the psychological round number support around the $1.20 and $1.00 handles.
If the bears continue to penetrate below the $1.00 handle, further support below this can be located at the medium-term downside 1.414 Fibonacci Extension level (drawn in blue) priced at $0.8803.
The RSI is trading underneath the 50 handle which indicates that the bears are still in control of the market momentum.
However, the RSI has recently been rising which indicates that the bearish momentum has started to lose steam. If the RSI can break above the 50 handle, this will show that the bulls have now started to take control of the market momentum.
Let us continue to analyze price action for LSK/BTC over the short term and highlight any potential areas of support and resistance moving forward within this market.
LSK/BTC – SHORT TERM – DAILY CHART
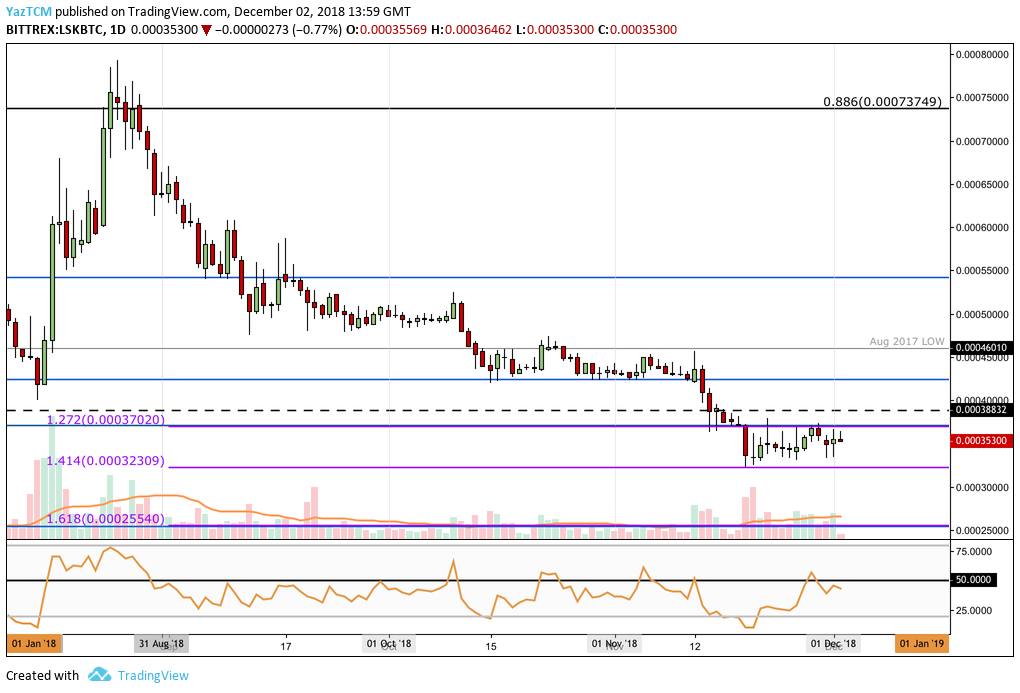
Looking at LSK/BTC from the short-term perspective, we can see that the recent price collapse during November 2018 has caused LSK/BTC to break below the December 2018 lows priced at 38,832 SATS and create new yearly lows.
The market decline had found support at the short-term downside 1.414 Fibonacci Extension level priced at 32,309 SATS where the market decline stalled.
Since reaching this support, we can see that LSK/BTC has been trapped within a narrow range between 32,309 SATS as the lower boundary and the downside 1.272 Fibonacci Extension level (drawn in purple) priced at 37,020 SATS as the upper boundary.
Looking ahead, if the buyers can penetrate above the upper boundary of the range at 37,020 SATS, we can expect immediate higher resistance to be located at the December 2017 low priced at 38,832 SATS, followed by further resistance at the 40,000 SATS handle.
Resistance above 40,000 SATS can then be located at the previous long-term downside 1.414 Fibonacci Extension level (drawn in blue) priced at 42,423 SATS, followed by the August 2017 low priced at 46,000 SATS.
Alternatively, in our bearish scenario, if the sellers begin to drive price action lower again, we can expect immediate significant support below to be located at the lower boundary of the range priced at 32,309 SATS. Support below the range can firstly be located at the 30,000 SATS handle, followed closely by the short-term downside 1.618 Fibonacci Extension level (drawn in purple) priced at 25,520 SATS.
The RSI has recently reversed and broken back below the 50 handle as the sellers regain control of the market momentum. If the RSI continues to remain below 50, we may see LSK/BTC head back toward the lower boundary of the trading range once again.