Litecoin has remained relatively stagnant over the past 24 hours of trading, not moving much towards the upside or the downside. The cryptocurrency is currently trading at the $60 handle after seeing a 7.74% price increase over the past 7 trading days.
Created by ex-google employee, Charlie Lee, in October 2011, Litecoin was intended to become a “lighter” rival to Bitcoin. It was designed to have faster transaction speeds and much lower fees than Bitcoin.
Litecoin also has the Lightning Network active which allows transactions to be processed off-chain, thereby reducing the load on the main blockchain.
The Lightning Network had recently made headlines as Forbes reported that an enterprising hacker was able to buy Coca-Cola through a customized vending machine using the (Bitcoin) Lightning Network. This showed how Lightning Network could enable small, quick transactions — something that could benefit LTC as well.
Litecoin is currently ranked 7th in terms of overall market cap across the entire industry. It has a total market cap value of $3.52 billion after the 65-month old cryptocurrency suffered a 30-day price decline totalling 31%. Litecoin is currently trading at a value that is 83% lower than its all-time high (ATH) price.
Let us continue to analyze price action for Litecoin over the long term.
Litecoin Price Analysis
LTC/USD – LONG TERM – DAILY CHART
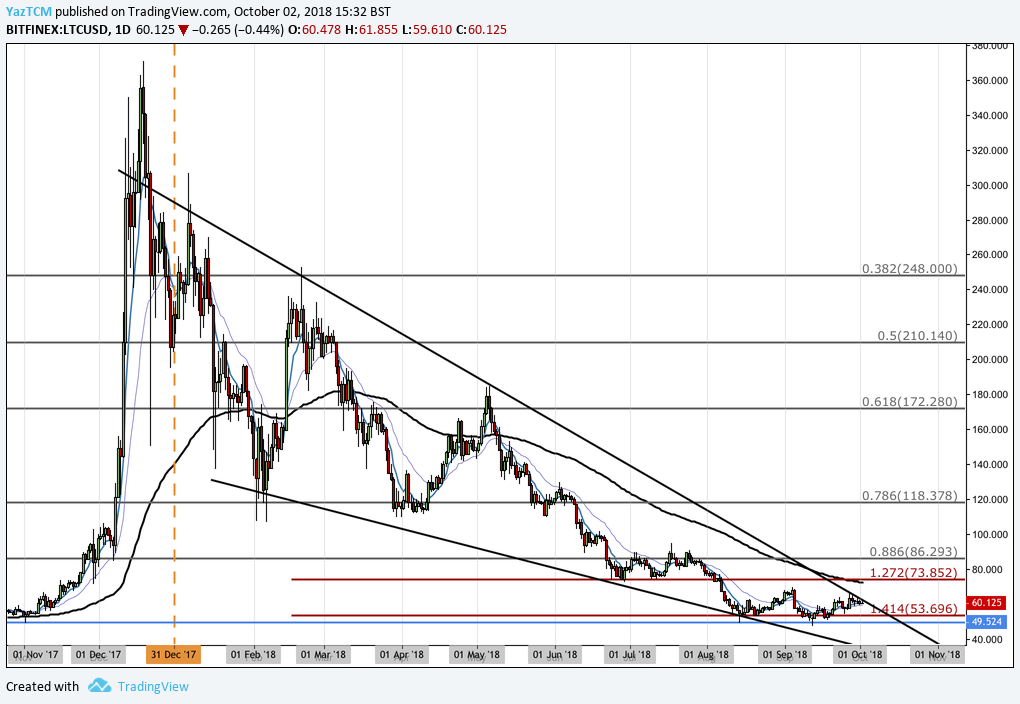
Analyzing the market for Litecoin over the long-term perspective above, we can see that the market had experienced an incredible bullish wave when price action started from a low of $49.02 on November 2, 2017 and extended to an ATH price of $370.78 on December 19, 2017. This was a price increase totaling 650% from low to high.
We can see that after price action placed the ATH, it began to roll over and decline. It had originally found some form of support at a .768 Fibonacci Retracement priced at $118.37 during February 2018. This Fibonacci Retracement is measured from the entire bullish run outlined above.
The market managed to stay above the support at $118 for the next few months. However, as June 2018 began trading, we can see price action dipped below the $118 handle and fell further below the $100 handle.
The market had found some support at a long-term downside 1.272 FIbonacci Extension level (drawn in red) priced at $73.85. We can see that this support level held during June and July 2018. However, as the industry wide bloodbath began during August 2018, price action fell lower.
We can see price action continued to fall until finding further support at the downside 1.414 Fibonacci Extension level (drawn in red) priced at $53.69. We can see that the market had even fell briefly to complete a 100% Retracement of the late-2017 bull run as price action reached the $49 handle once again.
It is also important to highlight that the market has established a very steep wedge formation that it has been trading within for the majority of the trading year. Price action is now approaching the apex of the wedge, and a breakout to the upside is widely anticipated.
Let us continue to analyze price action a little closer over the short term and highlight any potential support and resistance areas.
LTC/USD – SHORT TERM – DAILY CHART
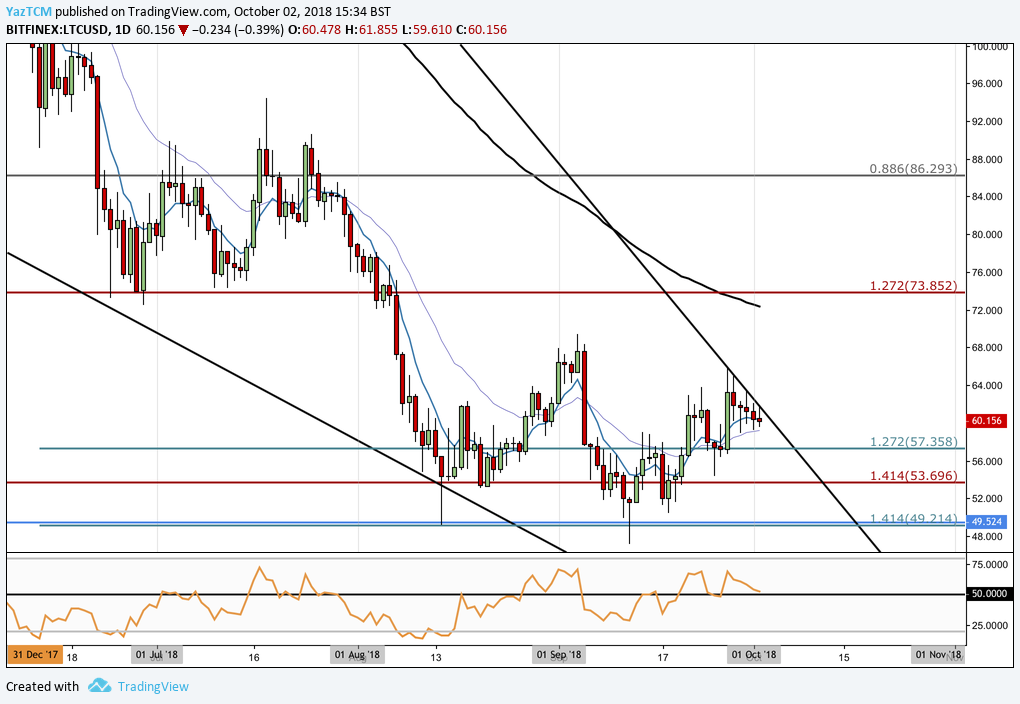
Analyzing the market from a closer time horizon, we can see that the support at the $49 handle was further bolstered by a short-term downside 1.414 Fibonacci Extension level (drawn in turquoise) priced at $49.21. As the market approached this area, it was rejected heavily, causing the market to rebound higher.
Price action is currently trading at resistance marked by the upper boundary of the trading wedge. Price action has been testing to break above the upper boundary but has failed to do so.
In the event that the bears push price action lower, we can expect immediate support to be located at the short-term downside 1.272 Fibonacci Extension level (drawn in turquoise) priced at $57.35. Further support located below this can then be expected at the long-term downside 1.414 Fibonacci Extension level (drawn in red) priced at $53.69.
If the bearish pressure continues to push the market even lower, we can expect more significant resistance at the short-term downside 1.414 Fibonacci Extension level (drawn in turquoise) again, priced at $49.12.
Alternatively, if the bulls can regather momentum and push price action above the upper boundary of the steep trading wedge, then we can expect immediate resistance higher to be located at the September 2018 highs priced at $69.28, followed by resistance at the 100-day moving average which is currently hovering around the $72 handle.
Further resistance above this can then be expected at the .886 Fibonacci Retracement level priced at $86.29.
The technical indicators within this market are currently producing neutral readings. The RSI is trading directly on the 50 handle, indicating that neither the bears or the bulls are in control of the momentum within the market.
If we would like to see a positive breakout of the trading wedge, we would need to see the RSI make a sustained break back above the 50 handle.
Let us continue to analyze price action for LTC relative to BTC over the long term.
LTC/BTC – LONG TERM – DAILY CHART
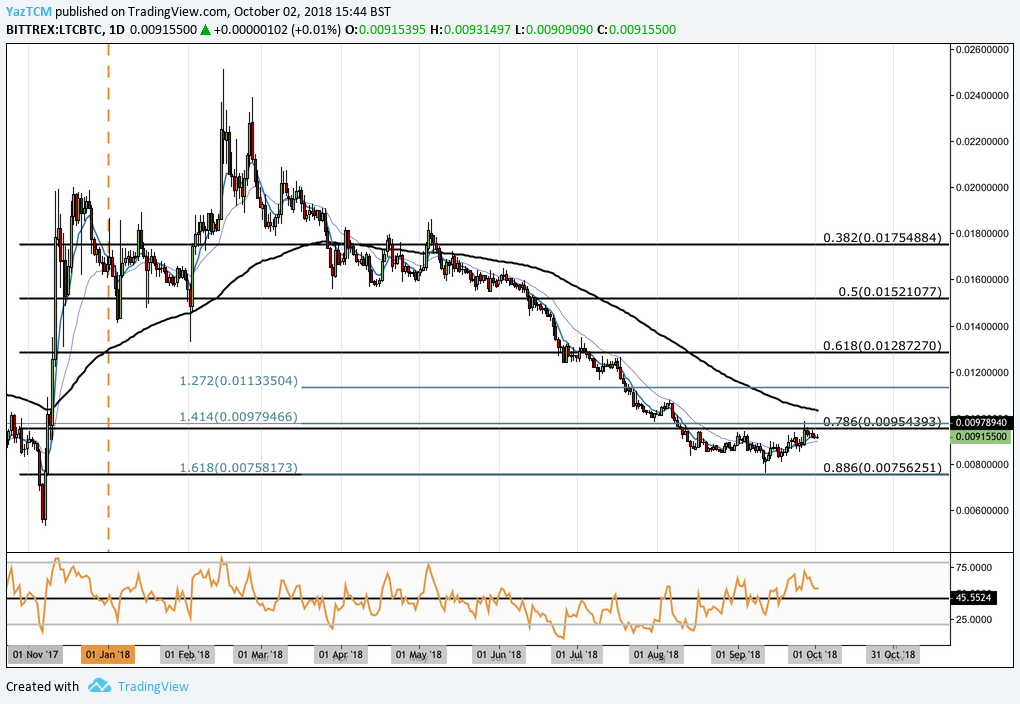
Analyzing price action for LTC/BTC from the long-term perspective above, we can see that the market had experienced a significant bullish run. Price action started from a low of 532,000 SATS on December 8, 2017 and extended to an all time high price of 2.5 million SATS on February 15, 2018. This was a price increase totaling over 355% from low to high.
We can see that after placing the ATH, price action rolled over and began to decline throughout the rest of the year after breaking below the 100-day moving average in May 2018.
The market continued to decline as the year progressed until price action had recently found some support at the .886 Fibonacci Retracement level priced at 756,000 SATS. As the market approached this level, it was rejected causing price action to rebound.
It is important to highlight that this area of support was further bolstered by a long-term downside 1.618 Fibonacci Extension level priced in the exact same area.
Price action is now trading at resistance provided by the .786 Fibonacci Retracement level priced at 954,000 SATS. If the bullish momentum can push price action above this resistance level, then we expect immediate resistance higher to be located at the 100-day moving average which is currently floating around the 1 million SATS handle.
Further resistance above this can then be expected at the previous downside 1.272 Fibonacci Extension level priced at 1.1 million SATS, followed by the .618 Fibonacci Retracement level priced at 1.28 million SATS.
Alternatively, if the bears re-enter the market and push price action lower, we can expect immediate support to be located at the .886 Fibonacci Retracement level once again priced at 756,000 SATS.
The technical indicators within this market are currently favoring the bulls at this moment in time. The RSI is currently trading above the 50 handle, indicating that the bulls are in control of the momentum. So long as the RSI stays above 50, we can expect the market to continue to regain some of its recent losses this year.