Lisk has experienced a decline totaling 3.11% over the past 24 hours of trading. The cryptocurrency is currently trading at $4.50, and has suffered a significant 10.29% drop over the past 7 trading days. However, it is important to note that the majority of altcoins are currently bleeding out at the same rate, so Lisk is not alone.
Lisk was created by Max Kordek and Oliver Beddows in May 2016, in order to enable developers within the the industry or create, deploy and distribute decentralized apps on the blockchain.
The Lisk SDK is built entirely in the JavaScript coding language. This means that it is accessible to the majority of developers in the world that can code in JavaScript. This enables more blockchain developers to enter the industry as it lowers the barrier to entry for development. Competitor projects, such as Ethereum, require developers to learn entirely new languages before being able to develop on their platform.
The Lisk network allows developers to create their own sidechain alongside the main Lisk blockchain. This helps improve the scalability of Lisk as the majority of transactions are taken place on the side chains for different projects, reducing the level of bloat building up on the main chain. This also allows developers to issue their own tokens, if they decide not to use the Lisk coin as their main means of value transfer.
Lisk is currently ranked 25th in terms of overall market cap across the entire industry, with a total market cap value of $488 million. The cryptocurrency has many losses to regain including the 15% drop recently experienced over the past 30 trading days.
Let us continue to analyze price action for Lisk over the long term.
Price Analysis
LSK/USD – LONG TERM – DAILY CHART
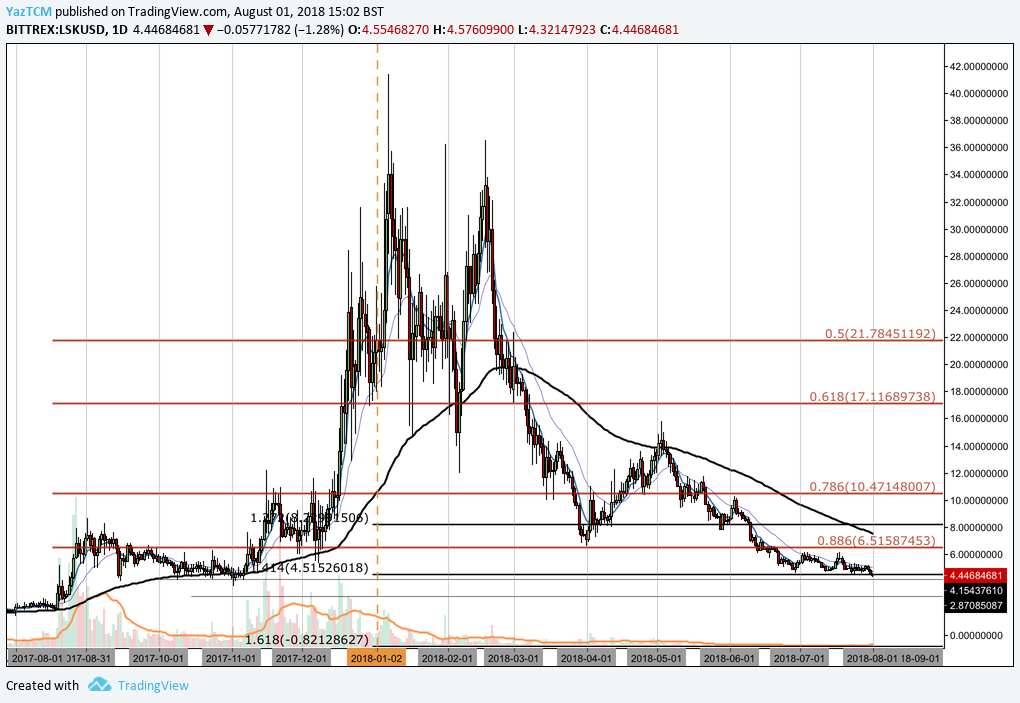
Analyzing the market from the long-term perspective above, we can see that Lisk had an incredible year during 2017 when price action started from a low of $1.84 on August 19, 2017 and extended to an all time high priced at $41.39 on January 7, 2018. This was an unprecedented price surge totaling over 2,290%.
The market went on to depreciate after placing this all-time high, originally finding support at the .618 Fibonacci Retracement priced at $17.11 during the first two months of 2018. However, during March, price action fell below $17.11 as well as the 100-day moving average, and continued to fall until reaching support at the .886 Fibonacci Retracement priced at $6.51. These Fibonacci Retracements are measured from the entire bullish run outlined above.
As June began to trade, we can see that the market fell further below the .886 Fibonacci Retracement until support was found at the 1.414 Fibonacci Extension level priced at $4.51. This is where the market is currently trading at this moment in time.
Let us continue to analyze price action a little closer over the more recent period to highlight any potential support and resistance zones.
LSK/USD – SHORT TERM – DAILY CHART
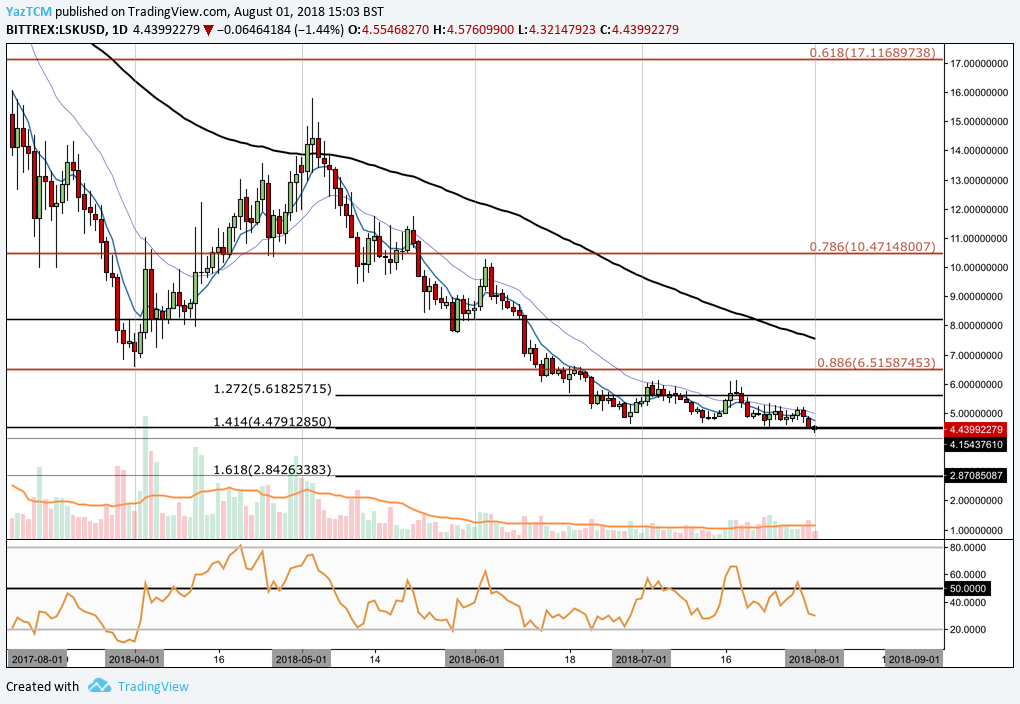
Analyzing the market over the shorter perspective, we can see that Lisk had experienced a smaller bullish run during April when price action started at a low of $6.55 on April 1, 2018 and rose to a high priced at $15.79 on May 3, 2018. This was a relatively small price increase totaling 140% from low to high.
Price action went on to create another bearish run during May 2018, and continued to fall during June and July 2018. We can see that price action has recently found support at the long-term downside 1.414 Fibonacci Extension (mentioned above) priced at $4.47. This area of support is significantly bolstered by another, shorter term, downside 1.414 Fibonacci Extension priced in the same area.
If the bearish momentum continues within the market, which is currently predicted, we expect immediate support to come in at the lows witnessed during October 2017, priced at $4.12. This level provided ample support during the entire month of October 2017. Further support below this level is expected at the short-term 1.618 Fibonacci Extension level priced at $2.84.
Alternatively, if the bulls can step back into the market, near-term resistance is expected at $5.61, followed by the previous long-term .886 Fibonacci Retracement Level priced at $6.51. Further resistance at $7 will require significant moment to be overcome due to the 100-day moving average being located within this area.
The technical indicators are currently favoring the bears within the market as the RSI trades below the 50 handle. For a sign that the bearish momentum is beginning to fade, look for the RSI to make its way back to the 50 handle. If the RSI can break above the 50 handle, this would indicate that the bullish momentum is beginning to build.
Let us continue to quickly analyze Lisk’s price action relative to Bitcoin over the long term.
LSK/BTC – LONG TERM – DAILY CHART
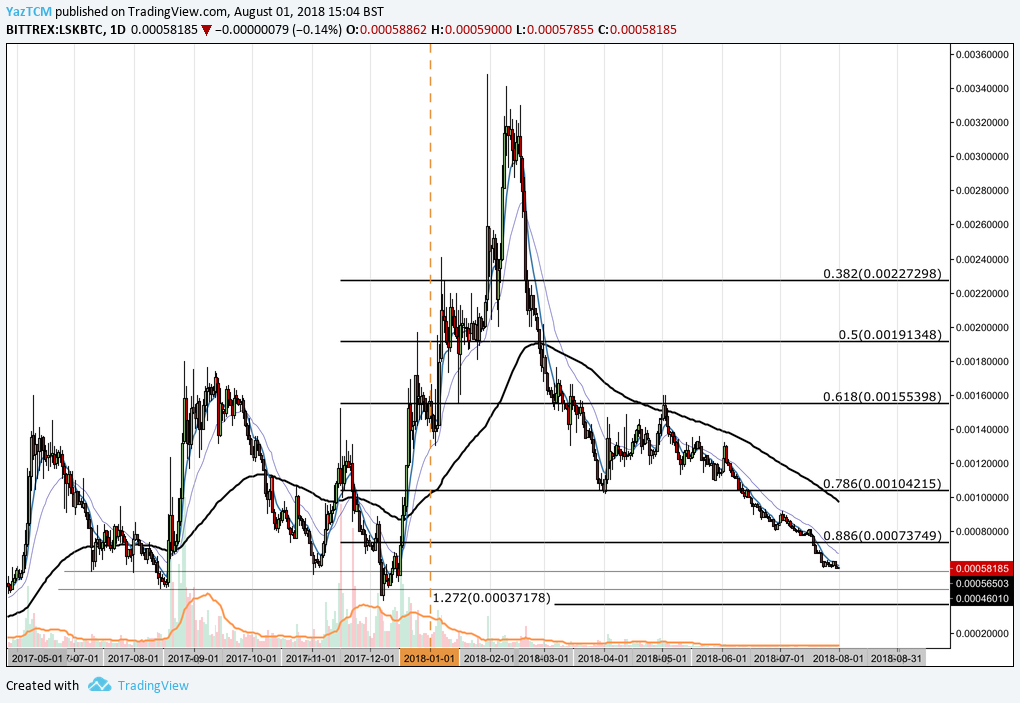
Analyzing the market from the long-term perspective above, we can see that Lisk had experienced a significant bullish run when price action started at a low of 39,102 SATS on December 8, 2017 and extended to an all-time high of 348,300 SATS placed on January 31, 2018. This was a price increase totaling 775% from low to high.
We can see that the market depreciated all the way, until some form of stable support was found at the .786 Fibonacci Retracement priced at 104,215 SATS during April 2018. However, as the bearish pressure continued in June, price action dipped below this level and continued lower until support was found at where it is currently trading at 56,300 SATS.
Let us continue to analyze price action a little further over the more recent period for highlight potential support and resistance zones.
LSK/BTC – SHORT TERM – DAILY CHART
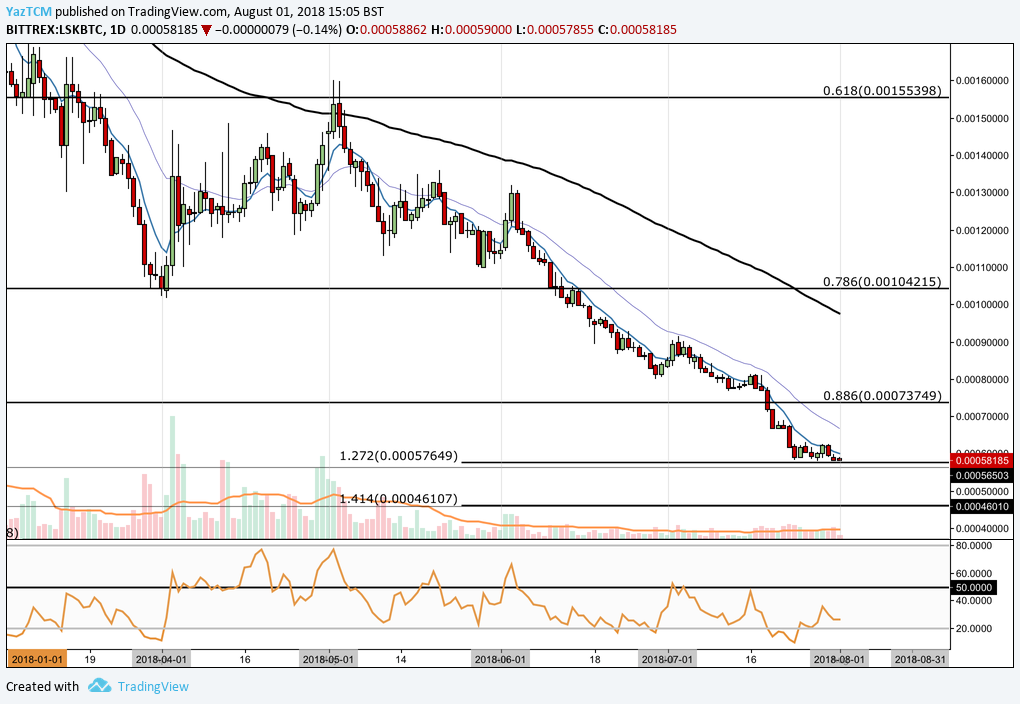
Analyzing the market from a shorter perspective above, we can see that the recent bearish momentum has pushed the market toward its current support level. This support level was bolstered by a downside 1.272 Fibonacci Extension priced at 57,649 SATS. This Fibonacci Extension is measured from the entire bullish swing witnessed through May 2018 and June 2018.
If the market continues lower, we expect significant support to be found at the 1.414 Fibonacci Extension level priced at 46,107 SATS. This area of support had provided significant support many times during 2017 in August, November and December. Each time price action approached this area, it acted as a significant buy zone where price action began its next bullish run.
To elaborate further, we expect this zone between the 1.272 and 1.414 Fibonacci Extensions to become a crucial buy zone for the cryptocurrency. If the market manages to dip further below this level, investors hands may prove to become progressively more shakier.
We can see that the momentum is heavily favoring the bears at this moment in time as the RSI trades well below the 50 handle. If we are to expect the bearish momentum to fade, we would need to see the RSI make it was toward the 50 handle and eventually break above it.
Related: Accountant Invests All in Lisk