
Komodo has experienced a small price increase totaling +2.74% over the past 24 hours of trading. The cryptocurrency is currently exchanging hands at a price of $1.15 after experiencing a +6.17% price hike over the past 7 trading days.
Komodo is a cryptocurrency platform project that promises to be a faster, safer and more decentralized cryptocurrency than its competition within the industry .
The cryptocurrency uses a tweaked version of PoW for its algorithm known as dPoW (delayed Proof-of-Work) which incorporates a notarization mechanism to help prevent a 51% cryptocurrency attack.
The project also can boast about its upcoming decentralized exchange known as Barter DEX. The DEX will allow users to transfer cryptocurrencies between each other without the need to use a centralized service such as Binance. Instead, users will exchange the cryptocurrencies on their respective blockchains through a process known as Atomic Swaps.
Other than the DEX and tweaked consensus algorithm, the Komodo project also offers a service that will allow users to create and distribute ICOs on their platform. This will be a decentralized service, and will require no middleman to run.
Komodo is currently ranked 56th in terms of overall market cap across the entire industry. It has a total market cap value of $124 million after suffering a loss of 26% over past 30 days and 56% over the past 90 trading days.
Let us continue to analyze price action for Komodo over the long term.
Price Analysis
KMD/USD – LONG TERM – DAILY CHART
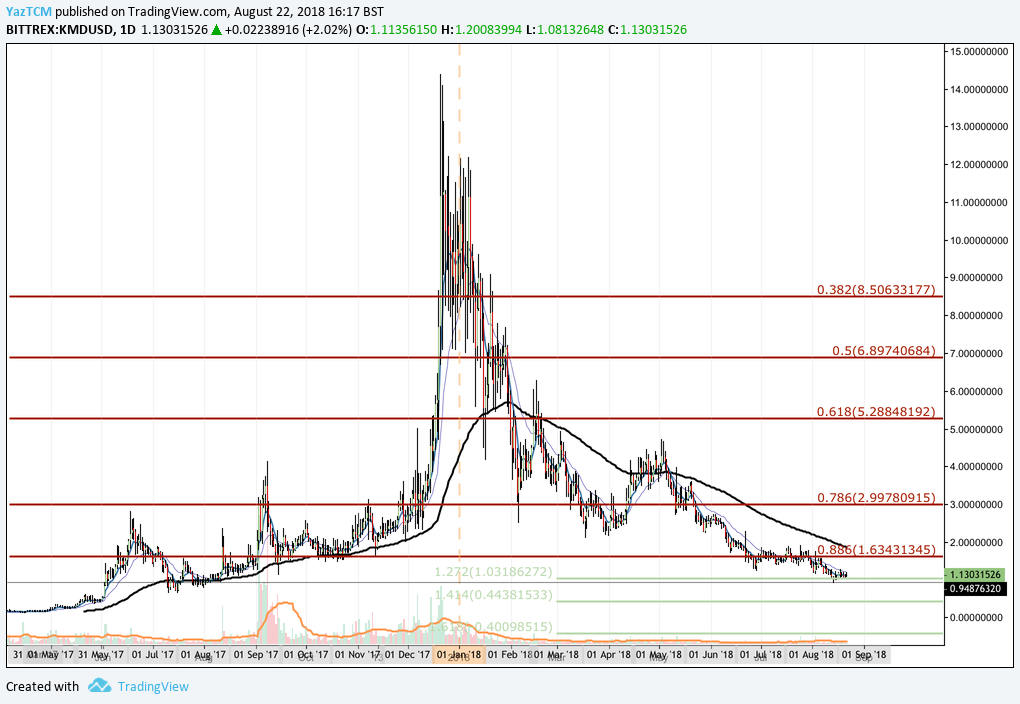
Analyzing price action from the long-term perspective above, we can identify the initial bullish trend witnessed throughout 2017 when price action started from a low of $0.11 on April 14, 2017 and extended to an all-time high of $14.38 on December 21, 2017. This was a price increase totaling 6,500% from low to high.
After placing this high, we can see that the market rolled over and began to decrease rapidly, originally finding support at the .618 Fibonacci Retracement level priced at $5.28 in January. This Fibonacci Retracement is measured from the entire bullish run seen throughout 2017. We can also see that the market was supported by the 100-day moving average throughout January 2018.
Price action continued to decline throughout the rest of the year, finding support at the .786 Fibonacci Retracement priced at $2.99 for the majority of the year. However, in June, price action slipped further.
We can see that the market continued to fall until finding strong support at the .886 Fibonacci Retracement level priced at $1.63. This support level held for the entire trading period of July 2018 but as August began to trade, the bears overpowered the bulls and pushed price action further lower.
We can see that the market is currently trading at support identified by the downside 1.272 Fibonacci Extension level priced at $1.03. Let us continue to analyze price action over the more recent period to highlight any potential support and resistance areas.
KMD/USD – SHORT TERM – DAILY CHART
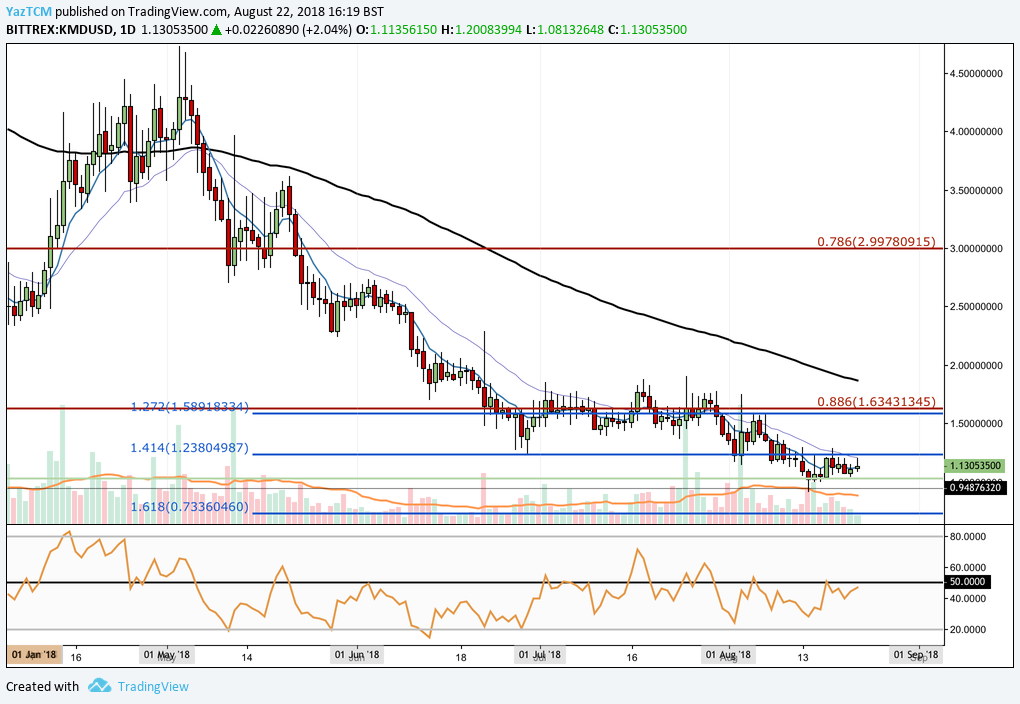
Analyzing the market from the shorter perspective, we can see that toward the end of June 2018, price action had found support at a short-term downside 1.414 Fibonacci Extension level (drawn in blue) priced at $1.23. This price level had also provided brief support for the market during August, but the bears managed to eventually break below.
Price action is currently trading at resistance highlighted by this previous support level at the downside 1.414 Fibonacci Extension level.
We can see that over the past trading week, the market has been bound within a range between the short-term downside 1.414 Fibonacci Extension level (drawn in blue) at $1.23 and the long-term downside 1.272 Fibonacci Extension level (drawn in green) priced at $1.03.
If the market can break above the resistance provided by the upper range of this short-term boundary, we expect immediate resistance to be located at the .886 Fibonacci Retracement level priced at $1.63. Further resistance above this level is expected at the 100-day moving average which is currently hovering around the $1.85 handle. Resistance expected above this level can be located at the psychological round number handle of $2.
Alternatively, if the bears step back into the market and push price action below the lower boundary priced at $1.03, we expect immediate support to be located around $0.91 which is the August low price. Further support expected below this level can be expected at the short-term downside 1.618 FIbonacci Extension level priced at $0.73.
The technical indicators are currently favoring the bears within the market as the RSI trades below the 50 handle. However, the recent rise of RSI out from oversold conditions indicates the prevailing bearish momentum has faded. If the RSI can create a sustained break above the 50 handle, we can expect this market to continue to regain some of the losses sustained over the last 90 trading days.
Let us quickly continue to analyze price action for KMD relative to BTC over the long term.
KMD/BTC – LONG TERM – WEEKLY CHART
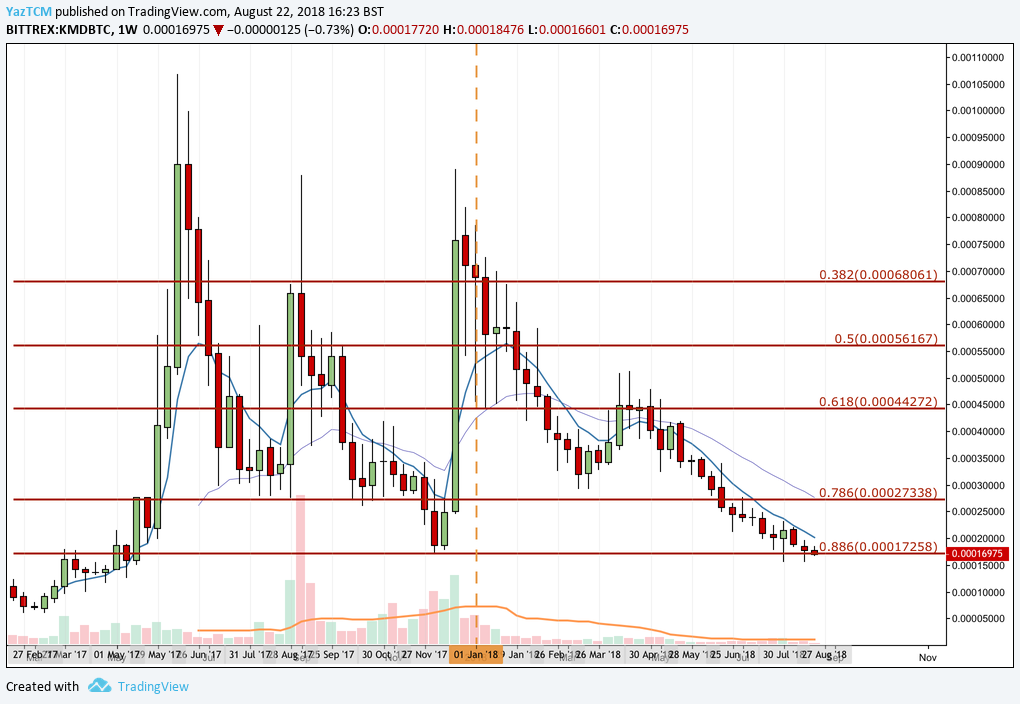
Analyzing the market from the long-term perspective above, we can see that in 2017 price action had experienced a large bullish run when price started at a low of 6,007 SATS on March 3, 2018 and extended to an all-time high of 106,800 SATS on June 18, 2017. This was a price increase totaling 1,560% from low to high.
After making this price high, we can see the market rolled over and declined, initially finding support at the .786 Fibonacci Retracement level priced at 27,388 SATS. This level had provided ample support throughout the rest of 2017, except for a brief period of 2 weeks when the market slipped further lower only to rebound at the .886 Fibonacci Retracement level priced at 17,258 SATS in December 2017.
We can see that after the market made another bullish run throughout December 2017, it went on to decline throughout the rest of 2018. It is currently once again trading at support marked at the .886 Fibonacci Retracement level priced at 17,258 SATS.
Let us continue to quickly analyze price action over the short term to highlight any potential support and resistance areas.
KMD/BTC – SHORT TERM – DAILY CHART
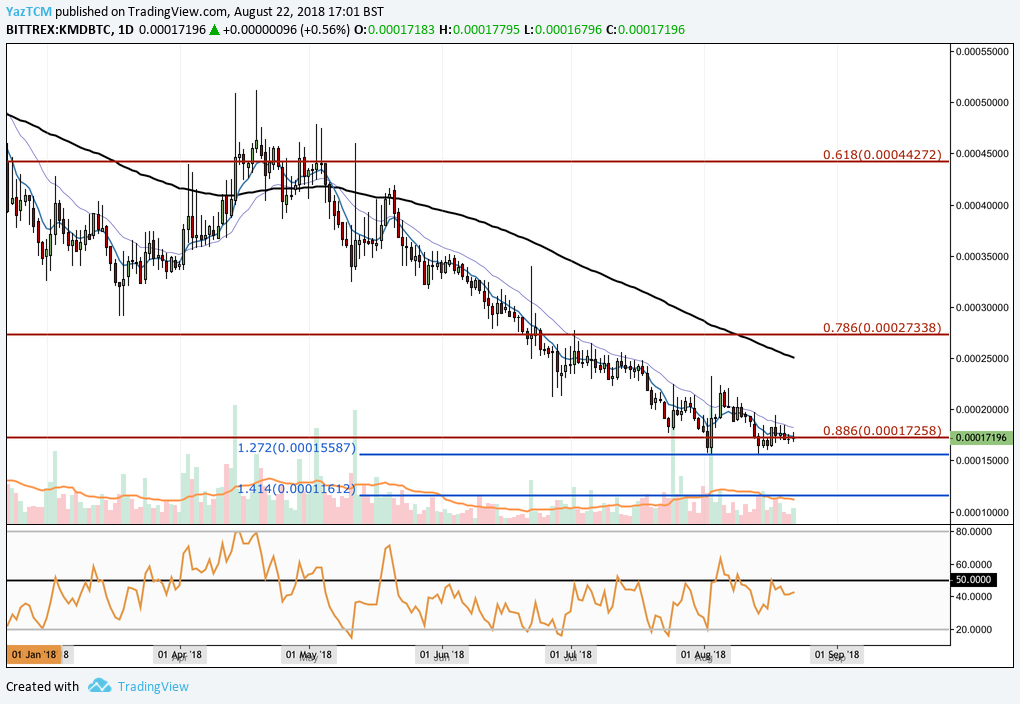
Analyzing price action in the short term, we can see that over the past 3 months price action has been rapidly declining. We can see that during August, it has been supported by a short-term downside 1.272 Fibonacci Extension level priced at 15,587 SATS.
If price action manages to break below this handle, we expect immediate support to be located at the 12,500 SATS region. Further support below this level is expected at the short-term downside 1.414 Fibonacci Extension level priced at 11,612 SATS.
Alternatively, if the market can remain supported by the long-term .886 Fibonacci Retracement level priced at 17,258 SATS, we expect immediate resistance to be located at the psychological round number handle of 20,000 SATS. Further resistance is expected around the 25,000 SATS handle which also contains the 100-day moving average.
The technical indicators are also favoring the bears within this market as the RSI trades below the 50 handle. If the RSI can break above 50, we can expect price action to start to make some gains.
Related: To the Moon! 7 Crypto Experts Pick Their Top Moonshot Coins