
IOTA has experienced a gain of 6.96% over the past 24 hours as the cryptocurrency giant trades at $1.06, at the time of writing. This small price increase comes after IOTA had experienced a tough period of 30 trading days where value dropped 11.67% in total.
IOTA is a known as a 3rd generation cryptocurrency, which uses a different distributed ledger technology than blockchain, known as Tangle. As a quick overview, the Tangle network makes users verify each other’s work creating a network of transaction verification.
As IOTA uses Tangle, this means that their network has many advantages over its blockchain competitors such as no transaction fees, faster transactions, having a quantum-proof network and the ability to send microtransactions. This leads many to believe that IOTA is much more scalable than other altcoins with a higher level of security.
IOTA is a complicated project to understand, so we highly recommend our “What is IOTA” guide.
The 13-month old coin, MIOTA, is currently ranked at 11th place in terms of overall market cap across the entire industry, with a total market cap value of $2.94 billion. This is a significant $4.28 billion lower than the market cap high of $7.22 seen on May 4, 2018.
Let us continue to analyze price action for IOTA over the long term.
Price Analysis
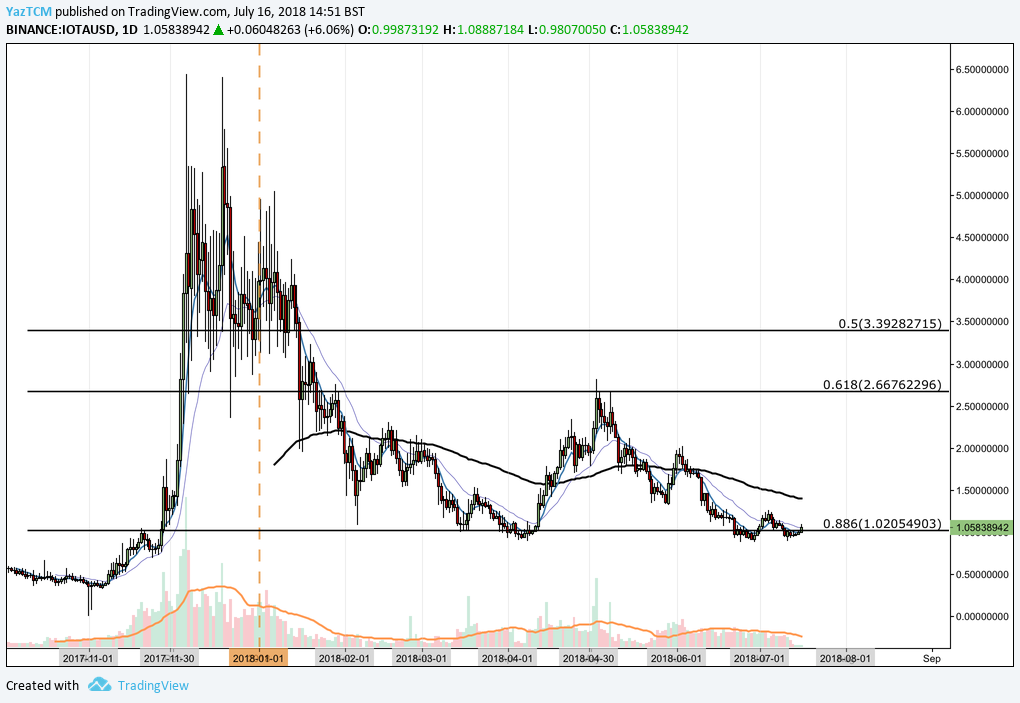
MIOTA/USD – LONG TERM – DAILY CHART
https://www.tradingview.com/x/32TdIRue/
Analyzing the chart from the long-term perspective above, we can see that IOTA had experienced a major bullish run when price action rose from a low of $0.32 on November 5, 2017 and extended to an all-time high priced at $6.43 on December 6, 2017. This was an incredible bullish price increase of 1,885% from low to high.
After placing the all-time high, we can see that the market went on to fall significantly as the new year started trading. We can see that price action had originally found support at the .618 Fibonacci Retracement in January 2018 priced at $2.66, but continued to fall until it found support at the 100-day moving average. The Fibonacci Retracement is taken from the entire bullish run described above.
During February, the market broke below the 100-day moving average and continued to fall until it found support at the .886 Fibonacci Retracement in March 2018 priced at $1.02. We can see that, for the majority of the year, the market has been trading largely within a range bound market trapped between the .618 Fibonacci Retracement at $2.66 and the .886 Fibonacci Retracement priced at $1.02.
Let us continue to analyze price action at a closer perspective to highlight any further potential support or resistance zones.
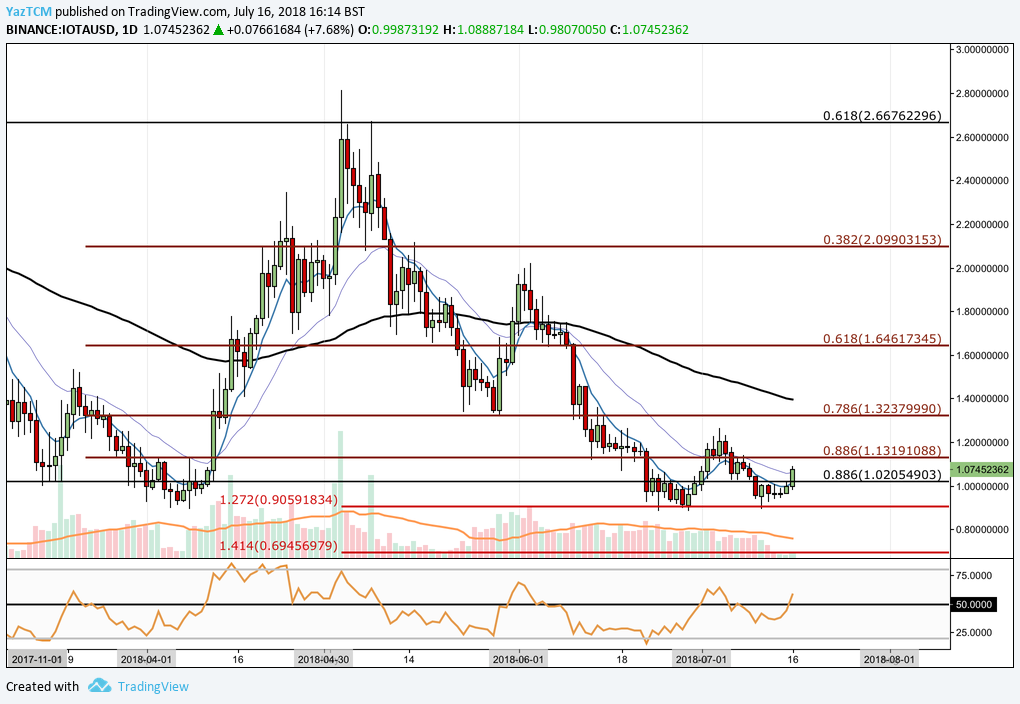
MIOTA/USD – SHORT TERM – DAILY CHART
https://www.tradingview.com/x/B9CrajK4/
Analyzing the market from a shorter time period, we can see that price action had experienced another smaller bullish run during April when the market rose from a low of $0.89 on April 8, 2018 and extended to a high of $2.81 placed on May 3, 2018. This was a price increase of 202% from low to high.
We can see that after placing the high in May, the market went on to fall and eventually retraced 100% of the bullish price increase described above. We can see that the market continued its fall through June 2018 until it found support at the 1.272 Fibonacci Extension level priced at $0.90. This is an extension taken from the entire bearish leg seen during May. This price level correlates with the price lows seen in April adding to the degree of support expected in this area.
The recent bullish momentum experienced over the past 24 hours has pushed the market back above the $1 handle. We can see that the market has currently met resistance at the 21-day EMA (falling purple line). If the bullish momentum can eventually push the market above the 21-day EMA, then near-term resistance is expected immediately at the short term .886 FIbonacci Retracement (drawn in red) priced at $1.13. If the market can continue further above this level, then resistance higher can be found at the short-term .786 Fibonacci Retracement priced at $1.32, which would be creating fresh monthly highs.
Alternatively, if the bullish momentum subsides and the bears step in once again, then near-term support is expected at the long-term .886 Fibonacci Retracement priced at $1.02, followed by the $1 handle.
The technical indicators are leaning toward the bulls at this moment in time. The RSI is trading above the 50 handle caused by the recent bullish momentum within the market. If the RSI can continue to remain above the 50 handle, then we can expect the bullish momentum to continue to build.
Similarly, the 7-day EMA (blue line) is approaching the 21-day EMA (purple line) for a bullish crossover. If these 2 moving averages can crossover one another, then this would serve as a confirmation signal that a short term bullish trend is in formation.
Let us continue to analyze IOTA’s market movement relative to Bitcoin.
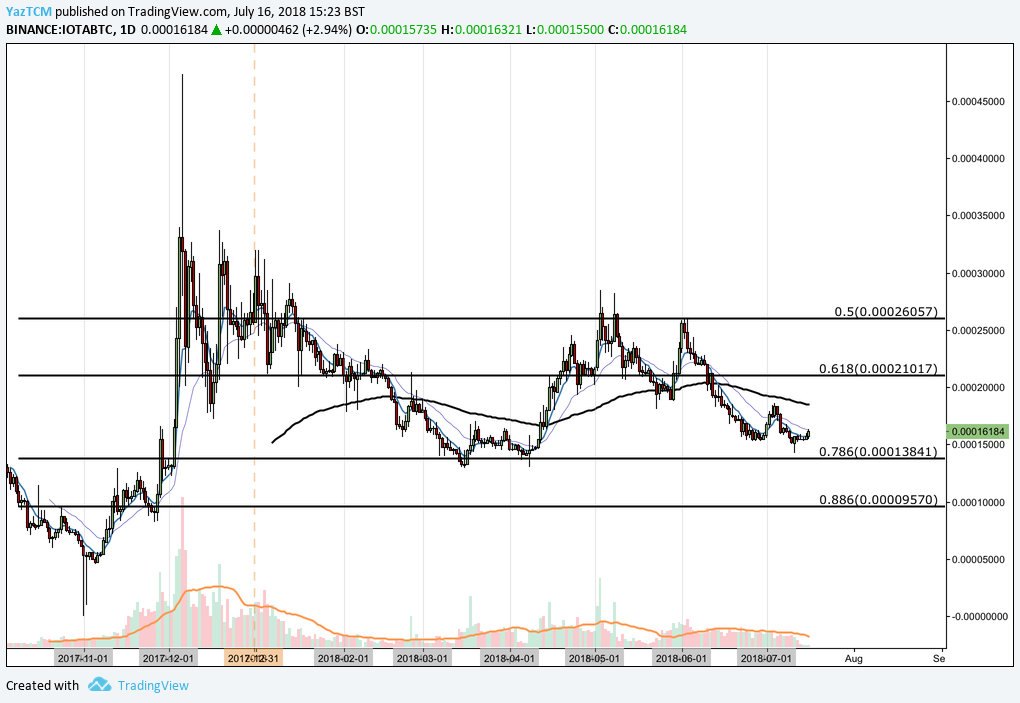
MIOTA/BTC – LONG TERM – DAILY CHART
https://www.tradingview.com/x/VkdkcN28/
Analyzing IOTA against Bitcoin, we can see that IOTA had a strong bullish price run when the market rose from a low of 4,709 SATS on November 6, 2017 and extended to an all-time high of 47,352 SATS experienced on December 6, 2017. This was a price increase of over 900% from low to high.
We can see that after placing the all-time high, the market went on to decline, originally finding support at the .618 Fibonacci Retracement priced at 21,017 SATS during January 2018. This is a Fibonacci Retracement taken from the entire bullish run described above.
We can also notice that the market has been largely trading within a range bound market condition throughout the majority of the year trading between the .50 Fibonacci Retracement priced at 26,057 SATS and the .786 Fibonacci Retracement priced at 13,841 SATS.
Let us continue to analyze price action over the more recent period a little closer to highlight potential support and resistance areas.
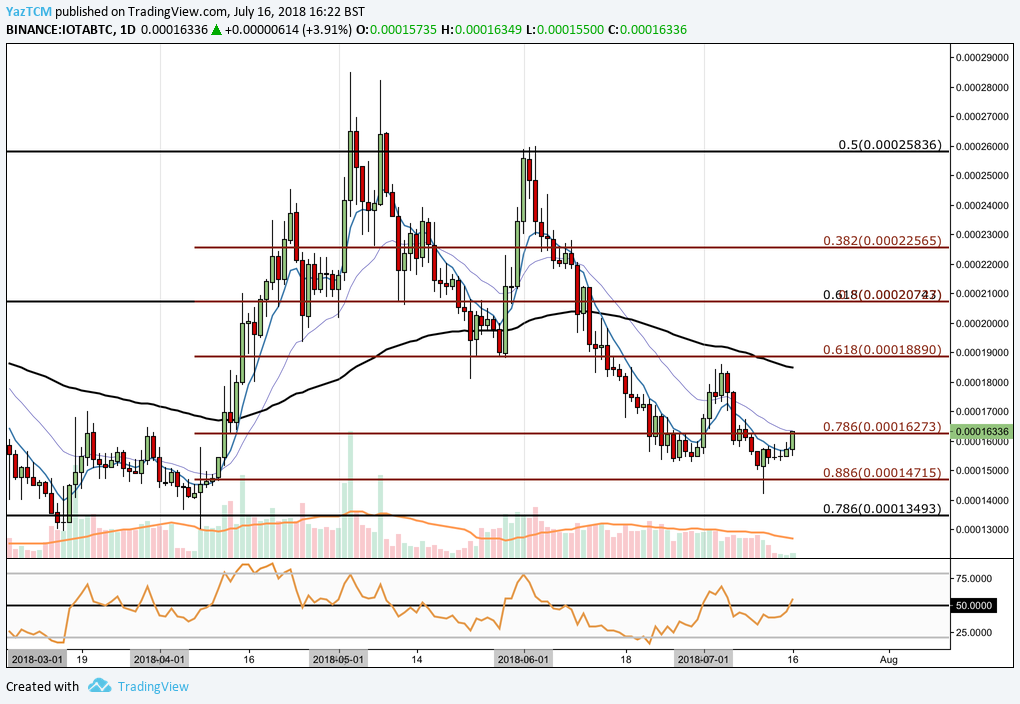
MIOTA/BTC – SHORT TERM – DAILY CHART
https://www.tradingview.com/x/B9CrajK4/
Looking at the market from a closer period, we can see that price action had experienced another price run during April when the market rose from a low of 13,000 SATS on April 8, 2018 and rose to a high of 28,500 SATS on May 3, 2018. This was a price increase of 115% from low to high.
After placing this high in May, we can see that market went on to depreciate, originally finding support at the short-term .618 Fibonacci Retracement priced at 18,890 SATS. This is a Fibonacci Retracement measured from the bullish run during April described above.
We can see that during June the market continued to fall beyond the .786 Fibonacci Retracement priced at 16,273 SATS. This is where the market is currently meeting resistance at this moment in time, after having briefly dropped to the .886 Fibonacci Retracement priced at 14,715 SATS.
If the bullish momentum can continue to push the market above the .786 Fibonacci Retracement, we can expect near-term resistance to come in at the .618 Fibonacci Retracement priced at 18,890 SATS. If the market is to reach this level, it will first need to overcome the 100-day moving average which is located slightly below the .618 FIbonacci Retracement. Further resistance beyond this level is located at the long-term .618 Fibonacci Retracement level located close to 21,000 SATS.
Alternatively, if the bears mange to push prices lower once again, we can expect immediate resistance to be located at the short term .886 Fibonacci Retracement priced at 14,715 SATS. Further support below this level can be located at the long term .786 Fibonacci Retracement priced at 13,493 SATS.
Conclusion
IOTA is an extremely ambitious project that is still relatively young in its development. Despite this, IOTA could be considered to be a relatively mature cryptocurrency as an evolution of the typical distributed ledger technology.
Like most cryptocurrencies, IOTA has dropped over a significant 80% from it’s all time high. This provides investment opportunities for those who believe in the project at extremely low prices.
Related: What the Future Holds for IOTA