
- IOTA has recently created a fresh 12-month low as it plummets below the $0.33 handle.
- The market has strong combined support at $0.30, but can the bulls hold here?
- Support moving forward: $0.30, $0.25, $0.2057, $0.1852, $0.17.
- Resistance moving forward: $0.33, $0.3708, $0.40, $0.4268, $0.50, $0.55, $0.60.
IOTA has seen a small 2.31% price drop over the past 24 hours of trading as the cryptocurrency continues to create fresh yearly lows. This comes after a harsh week for cryptocurrencies in general. During the week, IOTA suffered a 29% price decline, bringing the value of the cryptocurrency down to $0.3195.
IOTA is now ranked in 13th position in terms of overall market cap, with a current market cap of $887 million. IOTA has undergone a 35% capitulation over the past 30 trading days as the 17-month old project now trades at a value that is 93% lower than the all-time high value.
Let us continue to asses IOTA/USD over the long term and gain an insight over the market behavior.
IOTA Price Analysis
IOTA/USD – LONG TERM – DAILY CHART
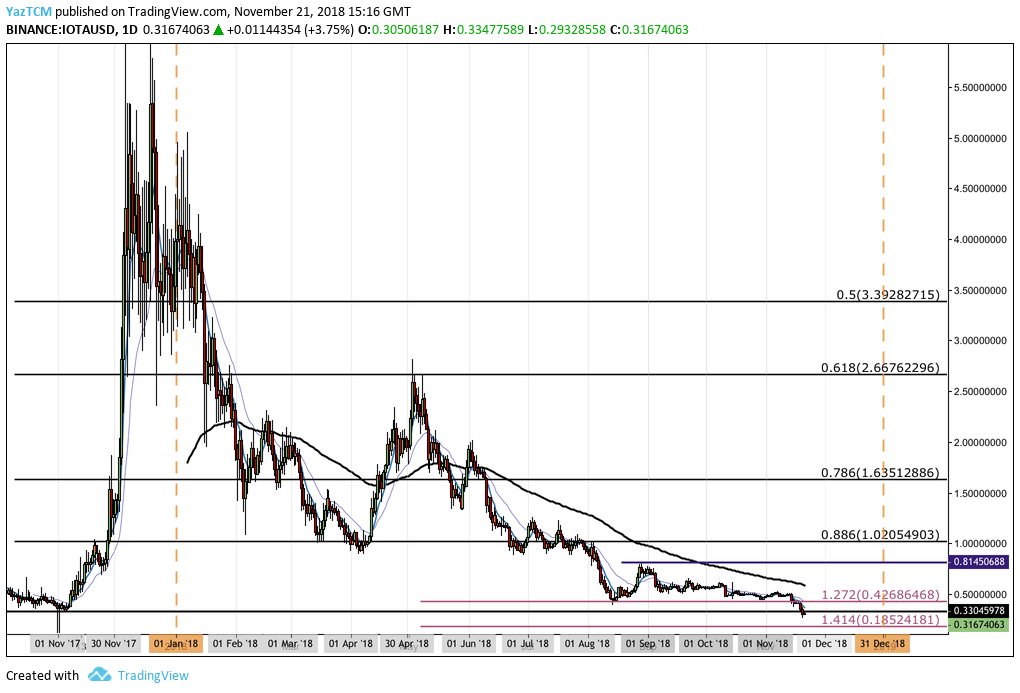
Analzsing price action from the long-term perspective above, we can see that the year has been difficult for IOTA/USD as the market has continued to decline consistently throughout trading in 2018.
We can also notice that the market has recently dipped below the price low for November 2017, as the market breaks below the $0.3304 handle.
Let us continue to analyze price action a little closer over the shorter term and highlight any potential areas of support and resistance.
IOTA/USD – SHORT TERM – DAILY CHART
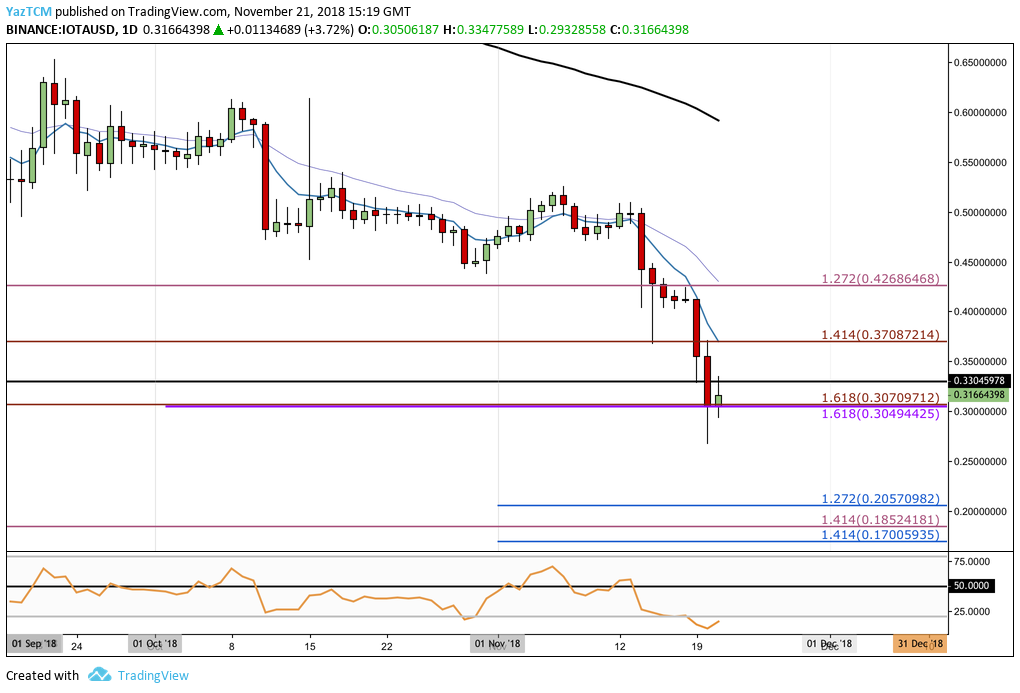
Taking a look at the market over the past few months, we can see that price action had fallen from a high above $0.50 on November 13. It recently reached a heavily supported area around the $0.30 handle. This price level is supported by a short-term and long-term downside 1.618 Fibonacci Extension level (drawn in purple and red) priced at $0.30.
As IOTA/USD approached this level of combined support, we can see that the downtrend has found a brief area of refuge from the bearish onslaught. The $0.30 handle also provides psychological round number support, further increasing the strength of the expected support here.
Moving forward, if the sellers continue with their aggressive pressure and push IOTA/USD below the support at $0.30, we can expect immediate support below to be located at the $0.25 handle, followed by the short-term downside 1.272 Fibonacci Extension level (drawn in blue) priced at $0.2057.
If the bearish momentum continues to penetrate below $0.20, we can expect further support at the long-term downside 1.414 Fibonacci Extension level (drawn in light purple) priced at $0.1852, followed by the short-term downside 1.414 Fibonacci Extension level (drawn in blue) priced at $0.1700.
On the other hand, in our bullish scenario, if the bulls can maintain price action above the $0.30 support handle and push IOTA/USD higher, we can expect initial resistance to be located at the November 2017 low priced at $0.3304.
If the bullish pressure continues to push the market higher, then more resistance above can be located at the previous short-term downside 1.414 Fibonacci Extension level (drawn in red) priced at $0.37, followed by the downside 1.272 Fibonacci Extension level (drawn in light purple) priced at $0.4268.
If the buyers continue to climb above the $0.45 handle, then we can expect further resistance above to be located at the $0.50 handle, followed by the $0.60 handle. The 100-day moving average is currently resting at the $0.60 handle which adds further to the expected resistance in this area.
The RSI is trading within oversold conditions at this current moment in time. However, we can see that it has began to turn upwards which could be a sign that the bearish momentum is. beginning to fade.
If the RSI can continue to rise and break above the 50 handle, we could expect IOTA/USD to make a recovery.
Let us continue to analyze price action for IOTA/BTC over the long term and gather an overview of the market.
IOTA/BTC – LONG TERM – DAILY CHART
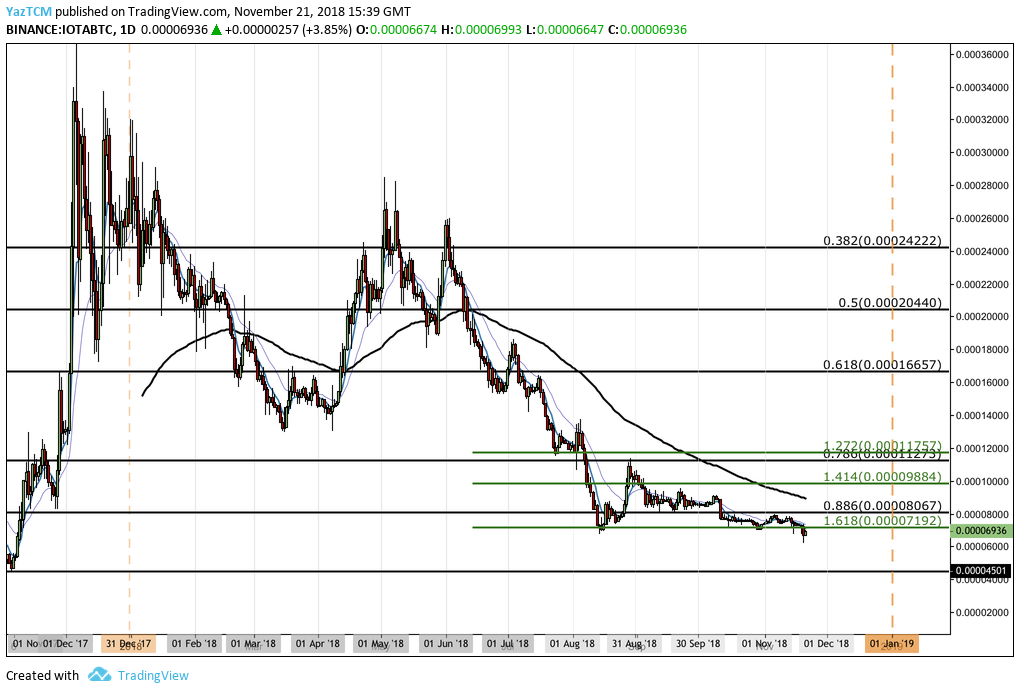
From the long-term perspective, we can see that IOTA has also been continuously falling against BTC over the course of the year.
The market had been holding strong above the downside 1.618 Fibonacci Extension level (drawn in green) priced at 7,192 SATS from August 2018 onwards. However, the recent market wipeout has caused IOTA/BTC to break below this support level as it currently trades at the 6,936 SATS handle.
Let us continue to analyze price action a little closer and highlight any areas of potential support and resistance moving forward.
IOTA/BTC – SHORT TERM – DAILY CHART
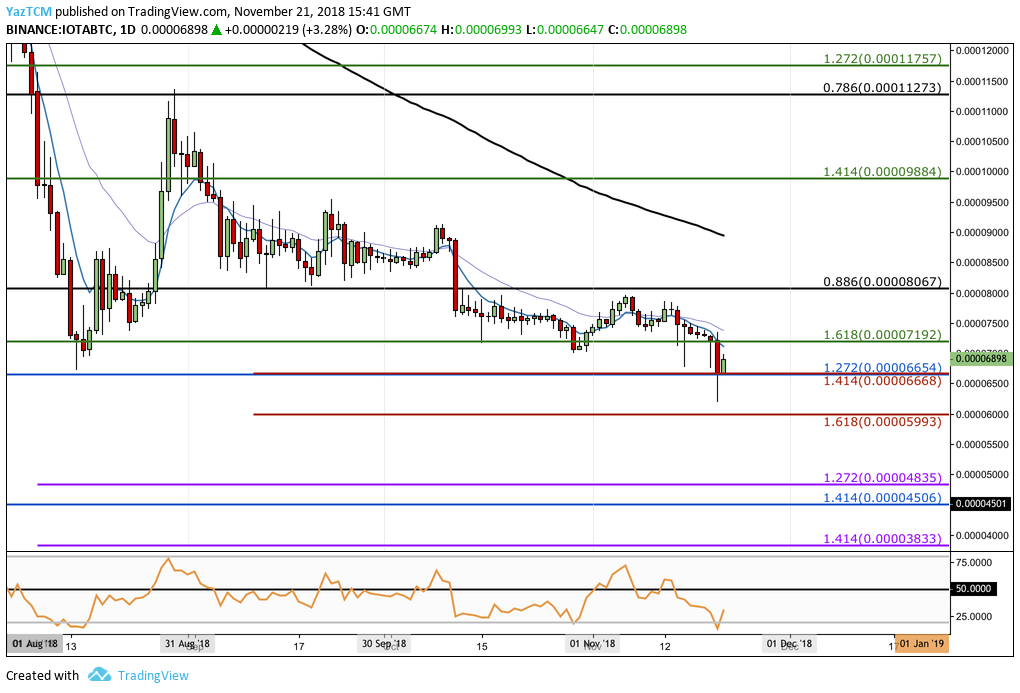
Analyzing the market from a closer time horizon, we can see that price action has found recent strong support at a medium-term downside 1.272 Fibonacci Extension level (drawn in blue) priced at 6,654 SATS.
This support is further bolstered by a short-term downside 1.414 Fibonacci Extension level (drawn in red) priced in the same area. We can see that during the market collapse on November 20, the bulls within IOTA/BTC had battled to close the session above this support level around 6,654 SATS.
Moving forward, if the sellers continue with their recent momentum and push IOTA/BTC below 6,654 SATS, we can expect immediate support below to be located at the short-term downside 1.618 Fibonacci Extension level (drawn in red) priced at 5,993 SATS.
If IOTA/BTC continues further below this level, then more support beneath will be expected at the 5,500 SATS handle, followed by the downside 1.272 Fibonacci Extension level (drawn in purple) priced at 4,835 SATS and the long-term downside 1.414 Fibonacci Extension level (drawn in blue) priced at 4,506 SATS.
Alternatively, if the bulls can continue to keep IOTA/BTC above 6,654 SATS and begin to grind higher, we can expect initial resistance above to be located at the previous downside 1.618 fibonacci Extension level (drawn in green) priced at 7,192 SATS, followed by the long-term .886 Fibonacci Retracement level priced at 8,067 SATS.
The RSI has also recently turned upward within this market as it recovers from oversold conditions. If the RSI can continue to climb, we can expect IOTA/BTC to remain above the 6,654 SATS support.