
- Horizen is trading within a wide trading range between $17.38 and $13.49.
- The RSI has returned to a neutral level after trading at oversold conditions during mid-October 2018.
- Support moving forward: $13.49, $13.00, $12.66, $12.50, $12.00.
- Resistance moving forward: $15.00, $17.38, $19.31, $20.00, $20.99, $25.00, $30.68.
Horizen has seen a small price increase of 0.23% over the past 24 hours of trading. The cryptocurrency is now exchanging hands at a price around $14.18, at the time of writing, after the project saw a 2.04% price hike over the previous trading days.
Horizen, formerly known as ZenCash, is now ranked 87th in market cap rankings, with a total market cap value of $69.5 million. The cryptocurrency has seen a turbulent 90-day period where price action has seen a precipitous 37% price drop.
The 17-month old project is now trading at a value that is 79% lower than its all-time high price.
Let u continue to analyze price action for ZEN/USD over the long term and assess market behavior.
Horizen Price Analysis
ZEN/USD – LONG TERM – DAILY CHART
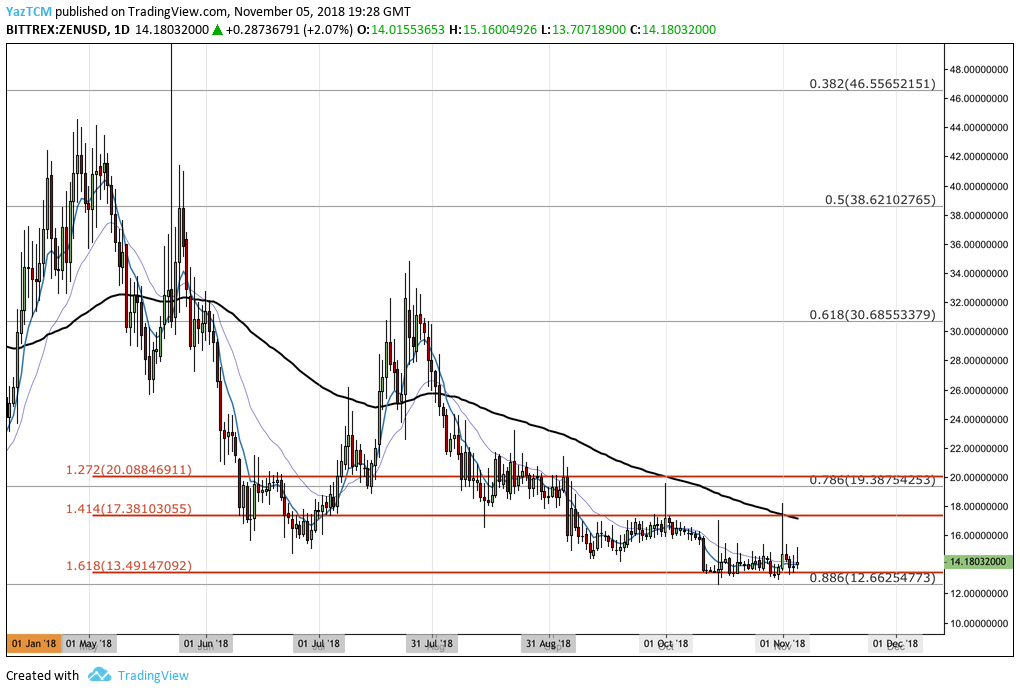
Taking a broad overview for ZEN/USD, we can see that since our last ZEN analysis, price action has continued to decline to our expected support zone at the downside 1.618 Fibonacci Extension level priced at $13.49. As the market reached this price level, it was prevented from dropping further lower as the bulls started to defend the price region.
The strength of the support was further increased by the long-term .886 Fibonacci Retracement which lies slightly lower as the $12.66 handle. This combined area of support was sufficient to halt the previous downtrend that the market had been experiencing.
Let us continue to analyze price action a little closer over the shorter period and highlight any relevant areas of support and resistance moving forward.
ZEN/USD – SHORT TERM – DAILY CHART
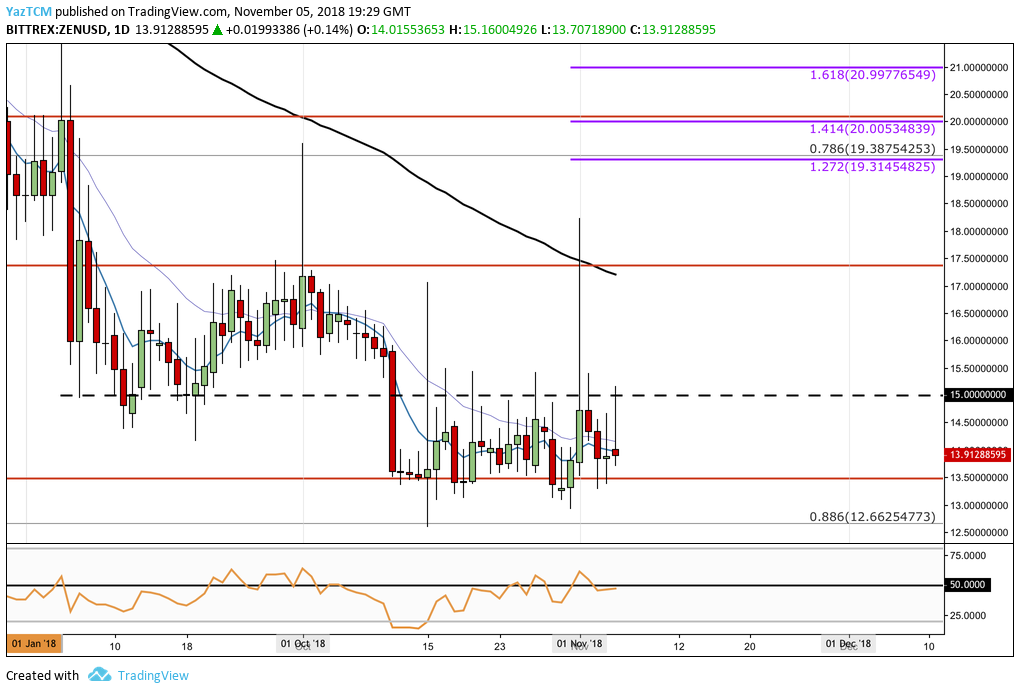
Analyzing the market with the benefit of a closer time horizon, we can see that for the past 2 trading months, the market has been trapped within a trading range between the downside 1.414 and 1.618 Fibonacci Extension levels, priced at $17.38 and $13.49 respectively.
Moving forward, in our bullish scenario, if the buyers can increase their dominance within the market and push ZEN/USD higher, we can expect immediate resistance above to be located at the psychological round number $15.00 handle. The market has struggled to break above this level during the second half of October 2018 and continues to battle with the level during November 2018.
If ZEN/USD can continue higher above the $15 handle, we can expect further resistance above to then be located at the upper boundary of the trading range around the $17.38 handle. It is important to highlight that this price level will require significant momentum to overcome due to the 100-day moving average trading slightly below the upper boundary of the range.
If the buyers can continue to climb up above the upper boundary, we can expect further higher resistance to be located at the 1.272 and 1.414 Fibonacci Extension level (drawn in purple), priced at $19.31 and $20.00 respectively. Higher resistance above this will then be located at the 1.618 Fibonacci extension level priced at $20.99.
On the other hand, in our bearish scenario, if the sellers continue to drive price action lower, we can expect significant support to be located at the lower boundary of the range priced at $13.49. If the sellers continue to push ZEN/USD lower, more support beneath can be expected at the psychological round number handle at $13.00, followed by support at the long-term .886 Fibonacci Retracement level priced at $12.66.
Since the second half of October 2018, the RSI has been grinding its way from oversold conditions below 20 to a neutral reading as it trades along the 50 handle. If the RSI can break up above 50, we could see this market make its way toward the upper boundary of the trading range.
Let us proceed to analyze price action for ZEN relative to BTC over the long term.
ZEN/BTC – LONG TERM – DAILY CHART
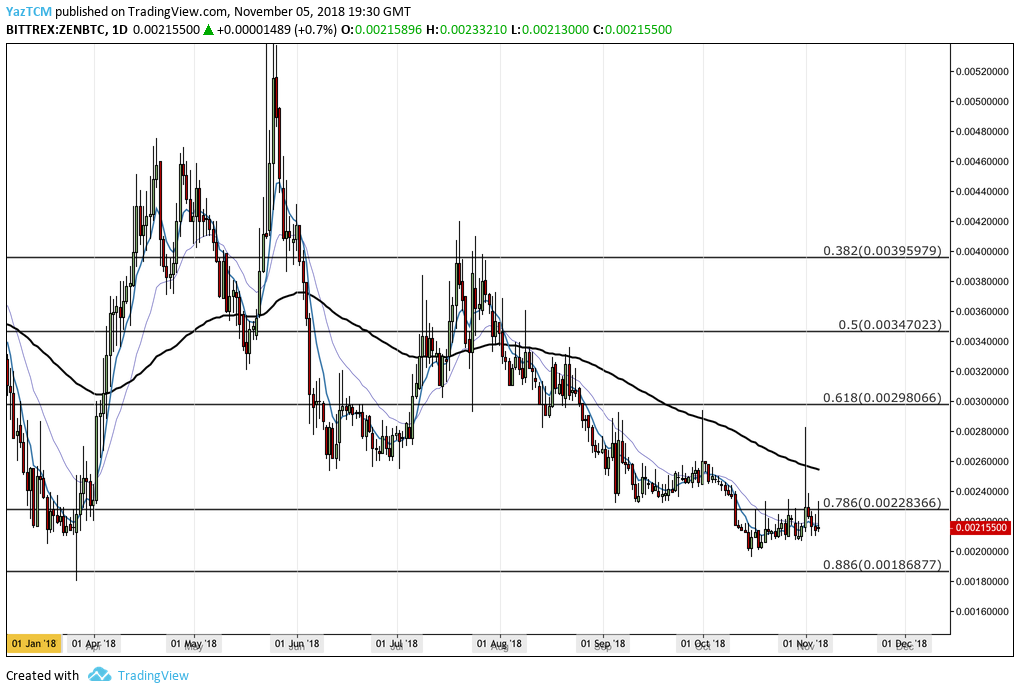
Analyzing the market from the long-term perspective above, we can see that the market has largely been falling for the majority of the year, despite some bullish runs during April and May 2018.
We can see that for the past 4 months price action has been consistently falling as it trades between the long-term .786 and .886 Fibonacci Retracement levels.
Let us continue to inspect the market a little closer and highlight some areas of potential support and resistance moving forward.
ZEN/BTC – SHORT TERM – DAILY CHART
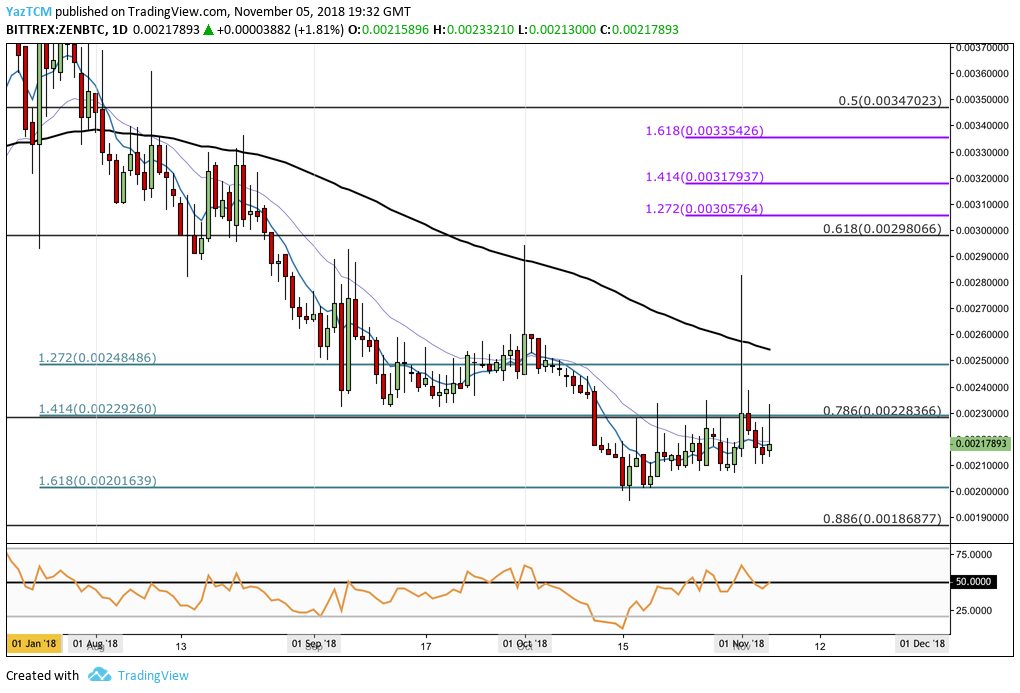
Observing the ZEN/BTC market at a closer distance, we can see that the downtrend had recently met support at a short-term downside 1.618 Fibonacci Extension level (drawn in turquoise) priced at 0.00201639 SATS. As the market reached this area, the buyers began to buy up the bottom which caused price action to reverse its previous downtrend.
We can see that after reversing, the market went on to rise but found resistance at the downside 1.414 Fibonacci Extension level priced at 0.00229260 SATS.
ZEN/BTC did spike up above this resistance level but failed to close above as the market continues to battle with the resistance. The area of resistance is also bolstered by the long-term .786 Fibonacci Retracement level which also trades within the same area.
Moving forward, if the bulls can climb up above the resistance at 0.00229 SATS, we can expect immediate higher resistance above to be located at the downside 1.272 Fibonacci Extension level priced at 0.00248486 SATS, followed by higher resistance at the 0.0028000 SATS handle.
If the bullish momentum can continue to drive the price further higher, then more resistance above can be expected at the .618 FIbonacci Retracement level priced at 0.00298066 SATS. This is followed by resistance provided by the short-term 1.272 and 1.414 Fibonacci Extension levels (drawn in purple), priced at 0.00305764 SATS and 0.003179377 SATS respectively.
The final level of higher resistance to highlight is at the 1.618 Fibonacci Extension level (drawn in purple) priced at 0.00335426 SATS.
Alternatively, in our bearish scenario, if the sellers pressure price action lower, we can expect immediate support below to be located at the previous downside 1.618 FIbonacci Extension level (drawn in turquoise) priced at 0.002016 SATS, followed by further support beneath at the long-term .886 Fibonacci Retracement level priced at 0.00186877 SATS.
The RSI is also trading in neutral territory within this market after a long battle for the bulls, pushing the RSI up from oversold conditions. If the bullish momentum can build and eventually crack above the 50 handle, we could see this market travel further higher.