
Gnosis has seen a 3.57% price increase over the past 24 hours of trading. The cryptocurrency currently is exchanging hands at a price of $28.63 after suffering a small 2.87% price decline over the past 7 trading days.
Gnosis was created in 2017 to become a decentralized prediction market on the blockchain. Typically, prediction markets use the “wisdom of the crowd” through a wide range of user predictions to aggregate information about upcoming future events. The prediction market will come up with the most likely outcome after running some algorithms on the data.
The Gnosis platform is built as an ERC-20 coin on top of the Ethereum blockchain. It sold over $300 million worth of coins in the first 10 minutes of launching their ICO.
The Gnosis team has also recently released a cold storage mobile wallet solution which allows users to store their coins safely in a user friendly manner.
Gnosis is currently ranked 143rd in terms of overall market cap across the entire industry. It currently has a total market cap value of $31 million after the 17-month old coin suffered a 45% price decline over the past 90 trading days. The cryptocurrency is currently trading at a 92% price level lower than its all-time high.
Let us continue to analyze price action for Gnosis over the long term.
Gnosis Price Analysis
GNO/USD – LONG TERM – DAILY CHART
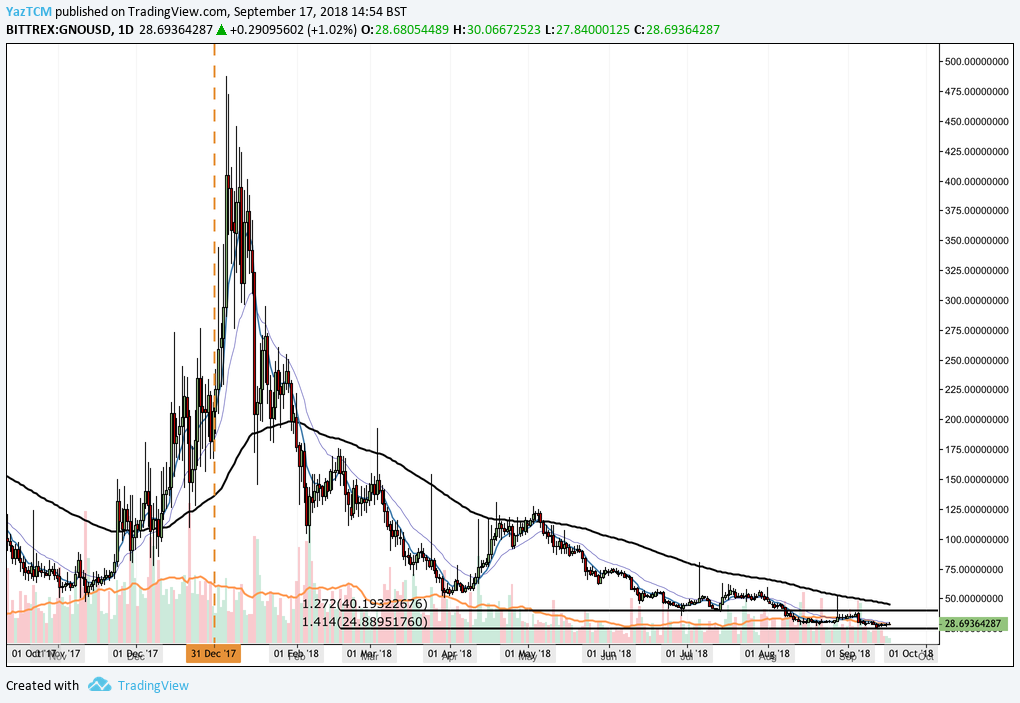
Analyzing the market from the long-term perspective above, we can see that price action had experienced a major bullish run toward the end of 2017 when the market started from a low of $47.08 on November 12, 2017 and extended to an all-time high price of $487.49 on January 5, 2018. This was an extraordinary price increase close to totaling 900% from low to high.
We can see that price action rapidly declined after hitting the all-time high price. The market retraced to the initial starting price of the bullish run relatively quickly as it reached this level during April 2018, and thereby completed a 100% Retracement of the late 2017 bullish run.
Price action had approached some support in July 2018 at the downside 1.272 Fibonacci Extension level priced at $40.19. We can see that this area of support held for the entire month of July 2018. However, as the August 2018 bloodbath commenced for the entire industry, we can see that Gnosis also slipped below this support level.
The market continued to fall until finding recent support at the downside 1.414 Fibonacci Extension level priced at $24.88. We can see that price action has found some stability at this price area and has started to trade sideways.
Let us continue to analyze price action a little closer over the short term to highlight any potential support and resistance areas.
GNO/USD – SHORT TERM – DAILY CHART
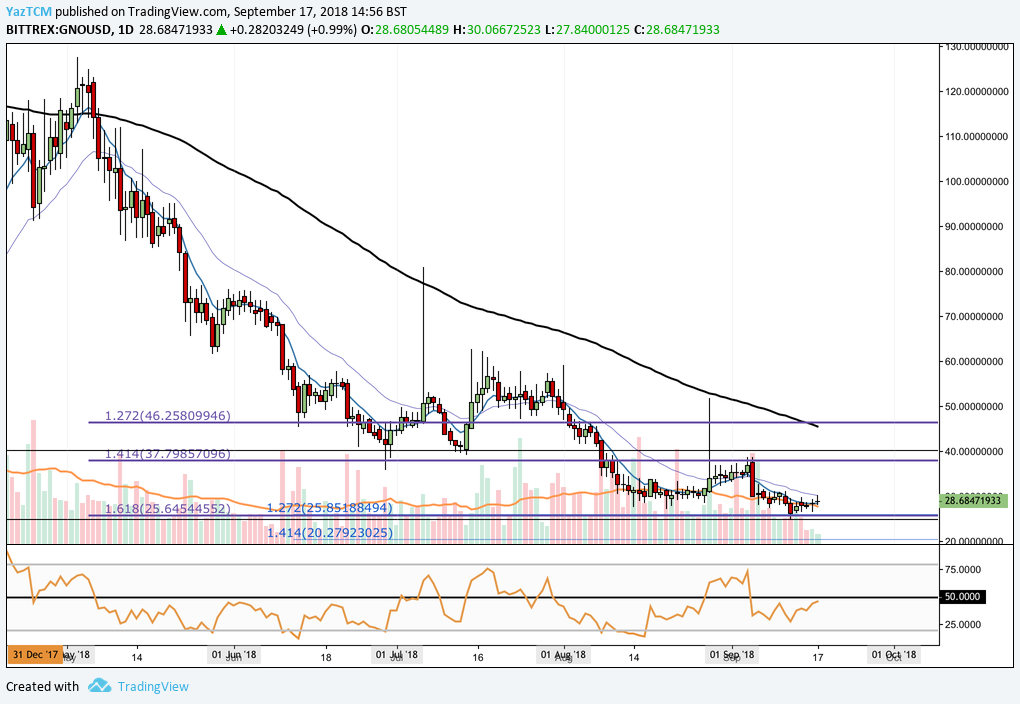
Analyzing the market from the benefit of a shorter time horizon, we can see that the recent long-term support at the downside 1.414 Fibonacci Extension level priced at $24.88 was significantly bolstered by a further downside 1.618 Fibonacci Extension level priced at $25.64 (drawn in purple) and a short term downside 1.272 Fibonacci Extension level (drawn in blue) priced at $25.85.
We can see that as the market approached this area of combined support, it was rejected heavily which caused price action to rebound.
The Gnosis market has now established a trading range, over the past 4 weeks. The range is bound between the short-term downside 1.414 Fibonacci Extension level (drawn in purple) priced at $37.79 as the upper range of the boundary and the downside 1.618 Fibonacci Extension level (drawn in purple) priced at $25.64 as the lower boundary of the range.
If the bulls can garner momentum at this area and push price action higher, we expect initial resistance to be located at the upper boundary of the trading range priced at $37.79. If the market can break above the upper boundary of the range, then further significant resistance will be expected at the psychological round number handle of $40.
Further significant resistance above the $40 handle can then be expected at the previous downside 1.272 FIbonacci Extension level (drawn in purple) priced at $46.25. This area of resistance is bolstered by the 100-day moving average which is currently hovering around this price area. tTherefore the market will require significant momentum to overcome this.
Alternatively, any negative pressure is expected to be absorbed by the lower boundary of the trading range priced at $25.64. If the market does indeed break below the lower boundary, then we expect immediate further support to be located at the short-term downside 1.414 Fibonacci Extension level (drawn in blue) priced at $20.27.
The technical indicators within the market are currently producing neutral readings. The RSI is trading at the 50 handle, indicating that neither the bulls nor the bears are in control of the momentum within the market.
However, the recent rise of the RSI from oversold conditions towards the 50 handle could indicate that the previous bearish momentum is showing signs of fading. If the RSI can continue to break above the 50 handle, then we can expect this market to continue to regain some of the recent incurred losses.
Let us continue to quickly analyze price action for GNO relative to BTC over the long term.
GNO/BTC – LONG TERM – DAILY CHART
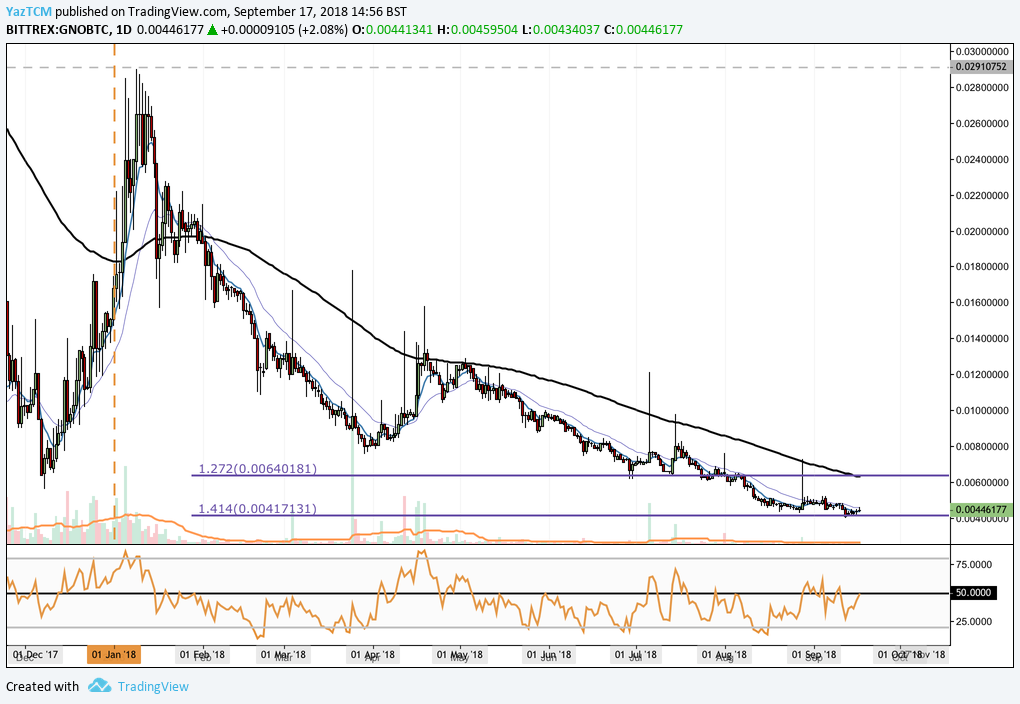
Analyzing the market from the long-term perspective above, we can see that GNO had experienced a bullish run against BTC. Price action started from a low of 0.0056 SATS on December 8, 2017 and continued to extend to a high of 0.029 SATS on January 8, 2018. This was a price increase of 405% from low to high.
We can see that after placing this high, price action rolled over and fell aggressively. It has continued to fall throughout the entire trading year, initial finding some support at the downside 1.272 Fibonacci Extension level priced at 0.0064 SATS in July 2018. However, as August 2018 started to trade, price action continued to drop further lower.
The market has recently found support at a downside 1.414 FIbonacci Extension level priced at 0.004171 SATS, and has rebounded. Price action has now established a trading range bound between 0.0064 SATS as the upper boundary and the 0.004171 SATS as the lower boundary.
The resistance at the upper boundary of the range will require significant momentum to overcome due to the 100-day moving average trading at this price range.
Related: Decentralized Prediction Markets: the Opportunities, the Threats, and the Platforms