
FunFair coin has seen a small 2.95% decline in price action over the past 24 hours of trading. The FUN cryptocurrency is currently exchanging hands at a price of $0.0162 after the cryptocurrency suffered a further 7.45% drop over the past 7 trading days.
Fun was launched in June 2017 when founder Jez San set out to create a solution for the online gaming industry. San, the founder of a successful online poker company called PKR, wanted to solve the issues currently faced by online gaming casinos regarding slow performance, high operating costs and low user trust.
The FunFair platform is not a casino in itself. Instead, the underlying technology developed by the FunFair team is licenced out to other online casinos and gaming platforms. FunFair would like to create an entire online trusted gaming ecosystem based on their technology.
The FunFair platform will allow casino owners to deploy their casinos in a few clicks, allowing them to remain focused on their marketing and operations. The casino utilizes a HTML5 web browser-based infrastructure, meaning that users will have no need to download applications which would increase the duration of the on-boarding process.
The odds provided by FunFair casinos can also be verified through smart contracts to prove that the casino is running a fair establishment.
FunFair is currently ranked 79th in terms of overall market cap across the entire industry. It has a total market cap value of $80 million after the cryptocurrency suffered a 10.51% price drop over the past 30 trading days. The 15-month old cryptocurrency is currently trading at a value that is 91% lower than its all-time high price.
Let us continue to analyze price action over the long term for FunFair against USD.
FunFair Price Analysis
FUN/USD – LONG TERM – DAILY CHART
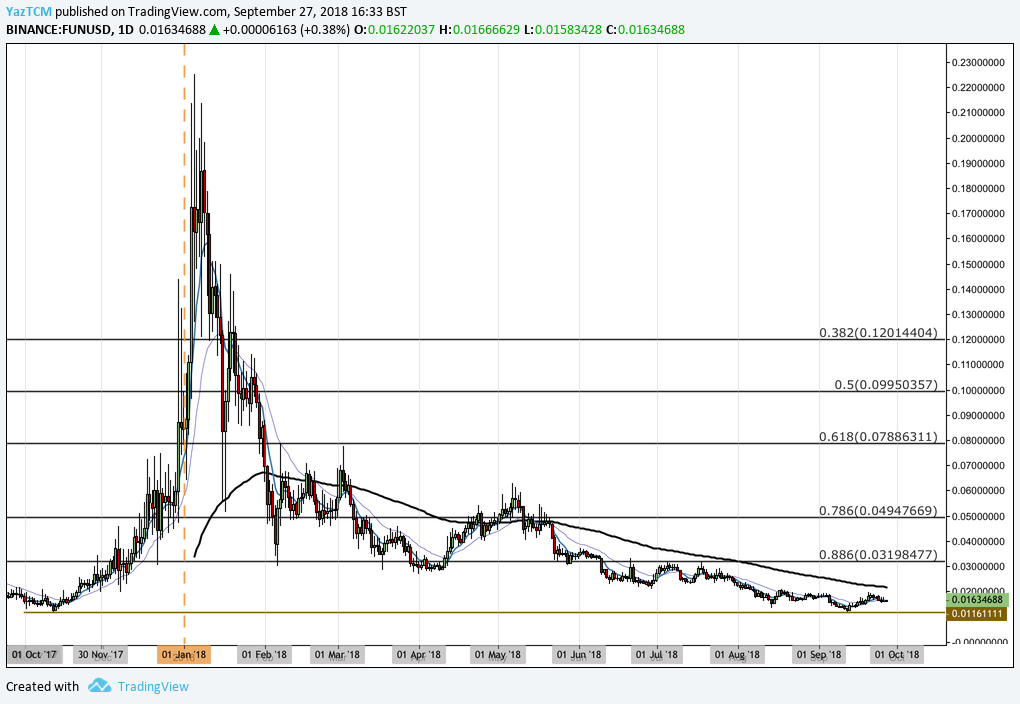
Analyzing the market from the long-term perspective above, we can see that price action had experienced a significant bullish wave when the market started from a low of $0.01134 on November 12, 2017 and extended to an all-time high of $0.2257 on January 5, 2018. This was an incredible bullish price run totaling over 1,750% from low to high.
We can see that after placing the all-time high in January 2018, price action rolled over and dropped significantly. It had originally found some level of support at the .886 FIbonacci Retracement level priced at $0.3198 in February 2018. We can see that this Fibonacci Retracement level had provided support for the market for the majority of the trading year until price action penetrated below this level during June 2018.
Since June 2018, price action has continued to fall. It has recently completed a 100% Fibonacci Retracement as the market touched the $0.011 handle in September 2018 before rebounding.
Let us continue to analyze price action for FUN over a shorter time period and highlight any potential support and resistance zones moving forward.
FUN/USD – SHORT TERM – DAILY CHART
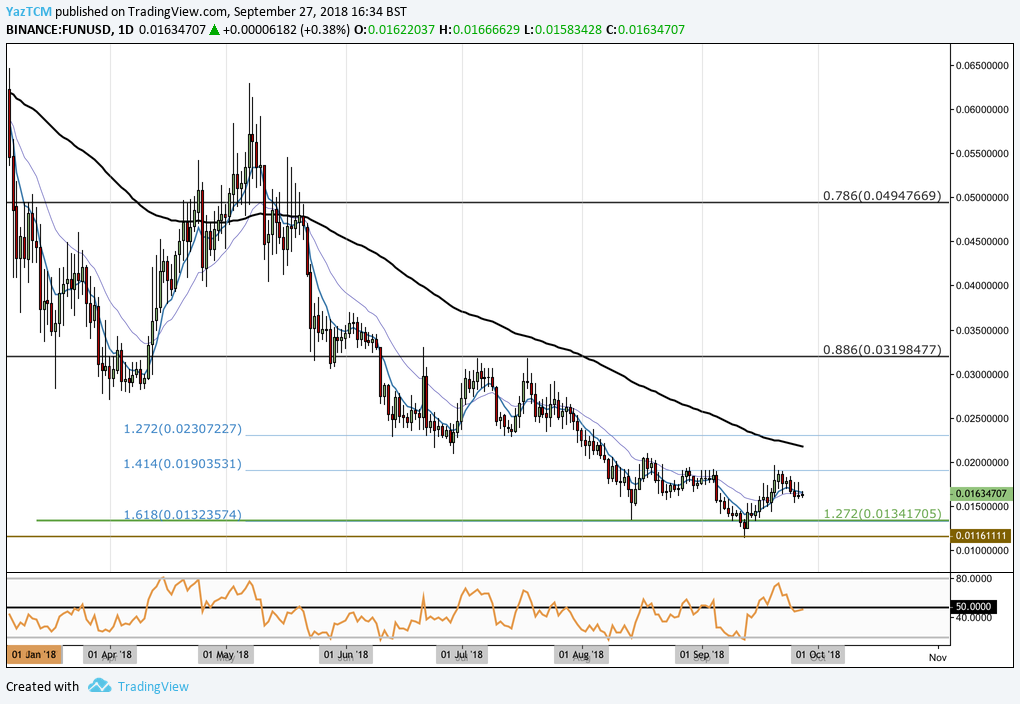
Analyzing the market over the short-term perspective above, we can see that price action had recently found support at a downside 1.272 Fibonacci Extension level (drawn in green) priced at $0.01341. As price action approached this level, it was rejected and rebounded aggressively.
Price action rebounded and continued to rise, until finding recent resistance markets by the short-term downside 1.414 Fibonacci Extension level (drawn in blue) priced at $0.01903. The market has established a tight trading range over the past 6 weeks, bound between the $0.01903 handle as the upper boundary of the trading range and the $0.01341 handle as the lower boundary.
Moving forward, if the bulls can continue with their recently birthed momentum and push the market above the upper boundary at $0.01903, then we can expect immediate further resistance higher to be located at the 100-day moving average which is currently hovering around the $0.02169 handle.
Further resistance above this is closely located at the short-term downside 1.272 Fibonacci Extension level (drawn in blue) priced at $0.02307. We can see that this price level had provided significant support for the market during June and July 2018. Therefore is expected to provide significant resistance moving forward (old support now becomes new resistance).
If the bulls can persist even higher, then the final level of resistance to highlight is the long-term .886 Fibonacci Retracement level priced at $0.03198.
Alternatively, any bearish pressure is expected to be absorbed by the lower boundary of the trading range priced at $0.01341. If price action does penetrate below the lower boundary, then we can expect immediate significant resistance located below at the $0.011 handle which is the initial starting point of the late-2017 bullish run.
The technical indicators within the market are largely producing neutral readings at this moment in time. The RSI is trading directly on the 50 handle, indicating that the market is still deciding which direction to head towards next — neither the bulls nor the bears are in control of the momentum.
If the RSI can break above the 50 handle, we could expect this market to continue to make solid gains.
Let us quickly analyze price action for FUN relative to Bitcoin over the long term.
FUN/BTC – LONG TERM – DAILY CHART
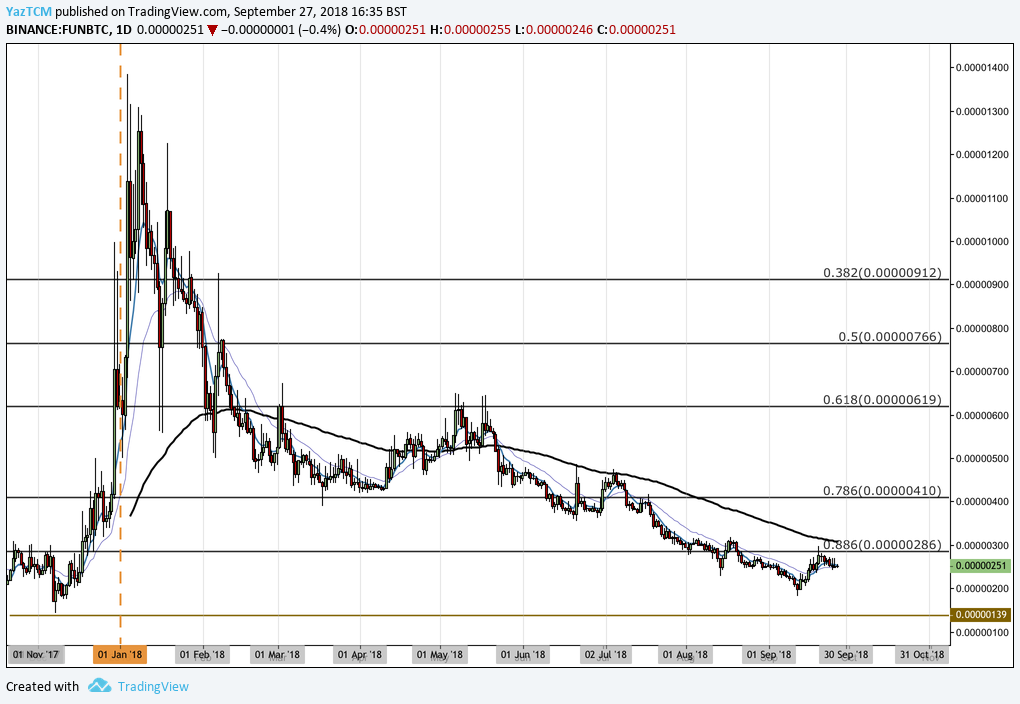
Analyzing the market from the long-term perspective above, we can see that there was a bullish run towards the end of 2017. Price action started from a low of 143 SATS on December 8, 2017 and extended to an all-time high of 1,385 SATS on January 4, 2018. This was a price increase totaling 830% from low to high.
We can see that after placing the ATH price, the market rolled over and began to decline rapidly. It had originally found some solid level of support at the .786 Fibonacci Retracement level priced at 410 SATS during March 2018. However, the market dipped below this level during June 2018, and continued to fall further lower.
The market is now trading at resistance provided by the .886 Fibonacci Retracement level priced at 286 SATS.
Let us continue to analyze price action a little closer over the shorter time horizon and highlight any potential areas of support and resistance.
FUN/BTC – SHORT TERM – DAILY CHART
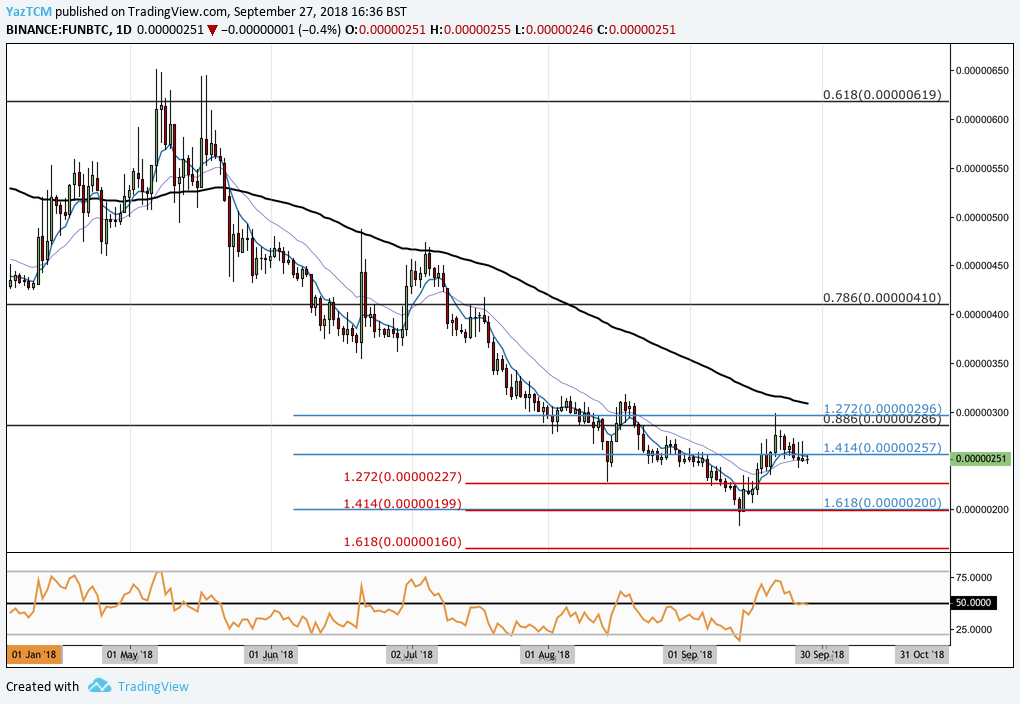
Analyzing the market from the shorter time horizon, we can see that price action had recently found support at a downside 1.618 Fibonacci Extension level (drawn in blue) priced at 200 SATS.
We can also see that this area of support was also significantly bolstered by a further shorter-term downside 1.414 Fibonacci Extension level (drawn in red) priced at 199 SATS. As price action approached this level it had rebounded significantly.
Price action rallied until meeting resistance at the long-term .886 Fibonacci Retracement level priced at 286 SATS. It is now trading at resistance provided by the downside 1.414 Fibonacci Extension level priced at 257 SATS.
Moving forward, if the bulls can push price action above the resistance provided at the 257 SATS and 286 SATS handle, then we expect further resistance located above at the 100-day moving average which is currently hovering around the 307 SATS handle. More resistance expected above this can then be located at the long-term .786 Fibonacci Retracement level priced at 410 SATS.
Alternatively, if the bears re-enter the market and push price action lower, we can expect immediate support at the short-term downside 1.272 Fibonacci Extension level (drawn in red) priced at 227 SATS. Significant support located below this level can then be expected at the combined support located at the 200 SATS handle.