
- FUN/USD drops below November 2017 low to create fresh 12-month low.
- The market is now trading at long-term support provided at $0.0065 as the bulls defend the area aggressively.
- Support moving forward: $0.0065, $0.0050, $0.0040, $0.0034, $0.0030.
- Resistance moving forward: $0.007, $0.008, $0.009411, $0.01, $0.01130, $0.01341
The cryptocurrency industry has experienced another drop over the past trading session and FunFair is one amongst the crowd that has seen a 24% price drop over the past 24 hours of trading. The cryptocurrency is now exchanging hands at a price around $0.0064, at the time of writing, as the market creates fresh 12-month lows.
FUN/USD has had a turbulent 7-day trading period as prices plunge by over 47%. The FunFair project is now ranked 113th and currently holds a $34 million market cap. The 17-month old coin has seen a 63% price decline over the past 90 trading days andis now trading at a value that is 96% lower than the all-time high price.
Let us continue to take a look at the FUN/USD market over the long term.
As FunFair has such a small market cap it is difficult to provide accurate analysis as one large player can change the course of the market instantly. However, we can provide technical levels of support to watch out for if the market does indeed keep dropping further.
FunFair Price Analysis
FUN/USD – LONG TERM – DAILY CHART
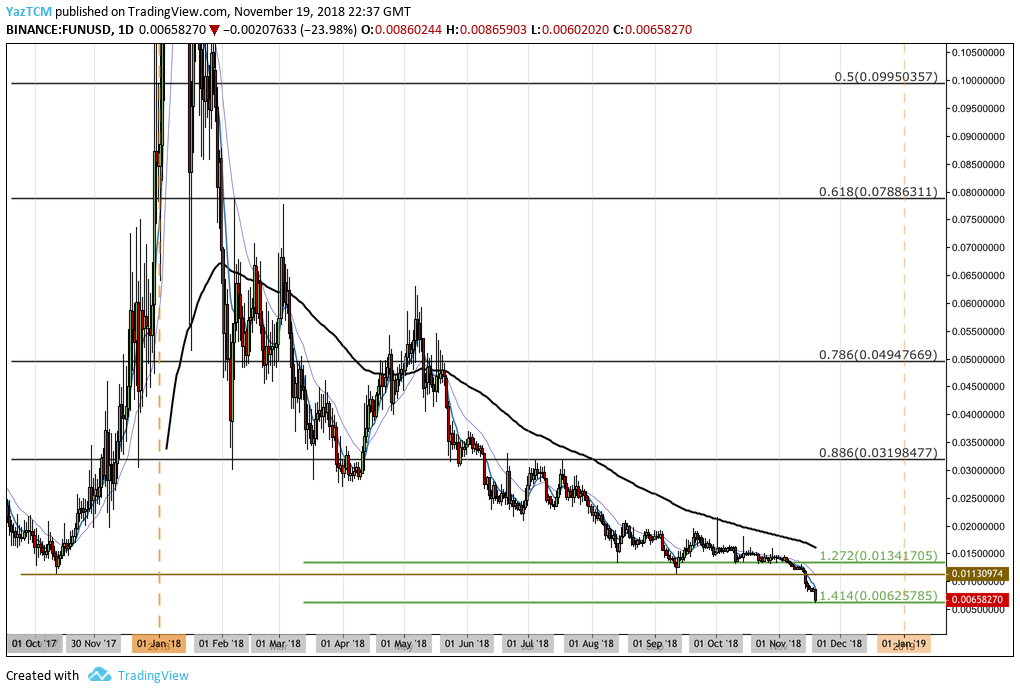
Examining the FUN/USD market over the long term, we can see that the market has been in a strong downtrend for the entire 2018 trading year.
It was expected that the market would find support around the November 2017 price low around $0.001130. However, over the course of November 2018, we can see that price action has penetrated below this support and has continued lower.
The market has recently found support at the long-term downside 1.414 Fibonacci Extension level (drawn in green) priced at $0.006257.
Let us continue to analyze price action a little closer over the short term and highlight any potential areas of support and resistance moving forward.
FUN/USD – SHORT TERM – DAILY CHART
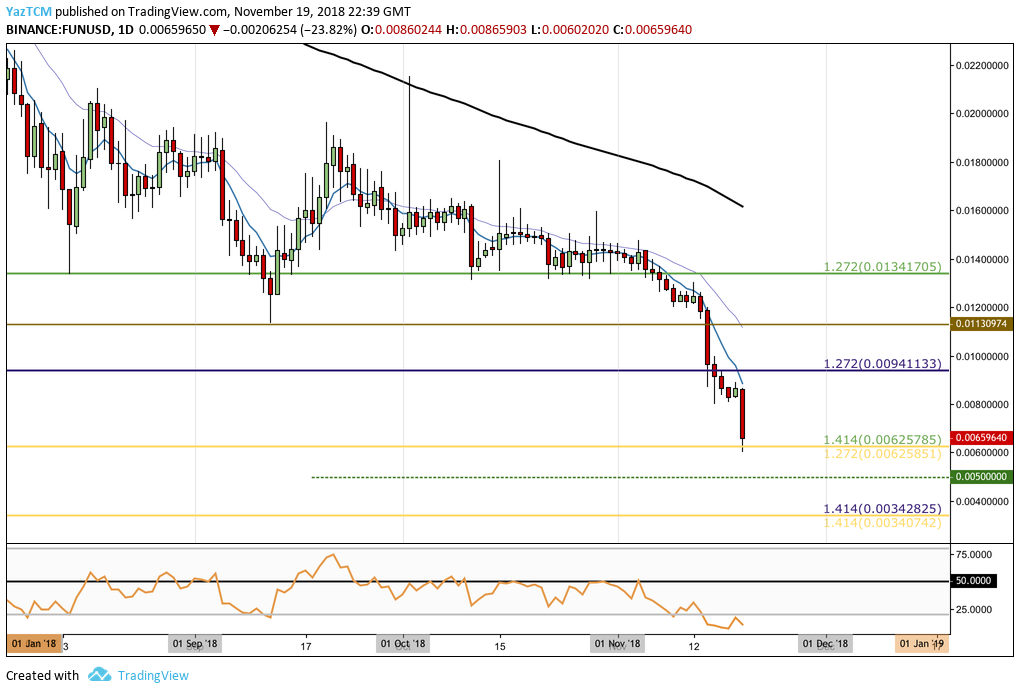
Analyzing the market with a closer time perspective, we can see that price action had slipped from support at the downside 1.272 Fibonacci Extension level (drawn in purple) priced at $0.009411 during mid-November.
The FUN/USD market has continued to fall over the previous session to further support located below at the downside 1.272 Fibonacci Extension level (drawn in yellow) priced at $0.006258. We can see that this support is further bolstered by the downside 1.414 Fibonacci Extension level (drawn in green) priced in the same area.
If the sellers continue with their pressure and push price action below the combined support at $0.0065, we can expect immediate support beneath to be located at the psychological round number level at $0.0050.
If the bearish momentum continues to push FUN/USD below $0.0050, we can expect further support beneath to be located at the downside 1.414 Fibonacci Extension level (drawn in yellow) priced at $0.003407. This area of support is also reinforced by another medium-term 1.414 Fibonacci Extension level (drawn in purple) priced at the same level.
On the other hand, if the buyers can re-enter the market and began the long grind back up, they will firstly encounter resistance at the $0.008 handle. Further significant resistance above this can be expected at the downside 1.272 Fibonacci Extension level (drawn in purple) priced at $0.009411, followed by the November 2017 low priced at $0.01130.
The RSI within this market is trading in extreme oversold conditions. This indicates the bearish momentum in charge of the market at this time. If the RSI begins to rise again, we could see FUN/USD beginning to make a recovery.
In turbulent market conditions, it is always important look toward the relative Bitcoin pairings for more guidance. Let us continue to analyze FUN/BTC over the long term and gain a better market perspective.
FUN/BTC – LONG TERM – DAILY CHART
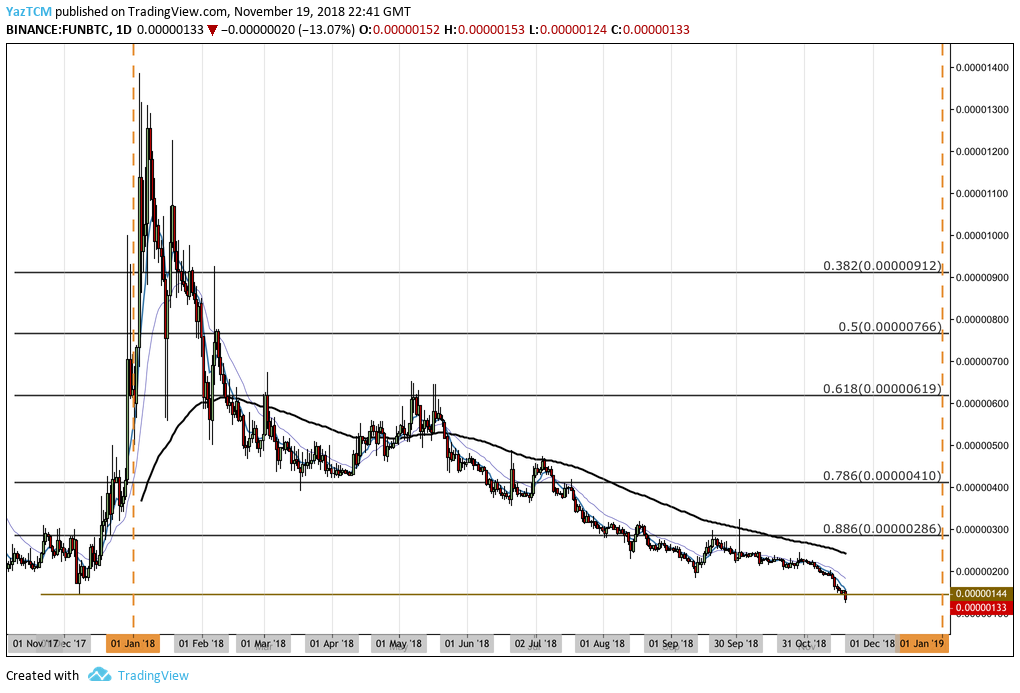
FUN/BTC has also been a declining market for the entire 2018 trading period. We can see that price action has recently broken below the December 2018 low of 144 SATS as the market creates a fresh all-time low at 124 SATS.
Let us continue to take a closer look at price action over the shorter term and highlight any potential areas of support and resistance moving forward.
FUN/BTC – SHORT TERM – DAILY CHART
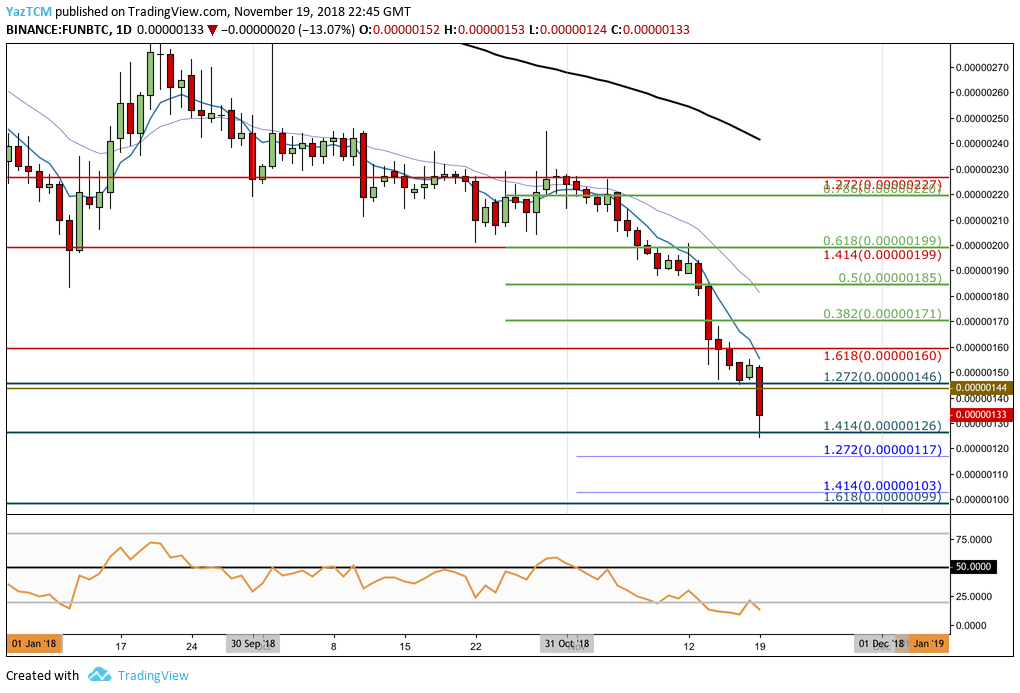
Analyzing price action for FUN/BTC from the short term perspective above, we can see that the recent price drop had found support at a medium-term downside 1.414 FIbonacci Extension level (drawn in turquoise) priced at 126 SATS.
Price action has since rebounded slightly from this support level.
Moving forward, if the sellers continue to pressure the support at 126 SATS and break lower, we can expect further support beneath to be located at the short-term 1.272 and 1.414 Fibonacci Extension levels (drawn in blue), priced at 117 SATS and 103 SATS respectively.
Further support marginally below is located at the medium-term downside 1.618 Fibonacci Extension level (drawn in turquoise) priced at 99 SATS.
Alternatively, if the support at 126 SATS continues to hold and the buyers begin their voyage higher, we can expect immediate resistance above to be located at the November 2017 low priced at 144 SATS.
Further resistance above can then be expected at the bearish .382 and .5 Fibonacci Retracement levels, measured from the last bearish swing lower, priced at 171 SATS and 185 SATS respectively.
If the buyers can continue to bring the market higher, further resistance above can be expected at the previous downside 1.414 Fibonacci Extension level (drawn in red) priced at 199 SATS. If the bulls can then climb up above 200 SATS, further resistance above can be located at the previous downside 1.272 Fibonacci Extension level priced at 227 SATS.
The RSI is also now trading within oversold conditions for FUN/BTC. However, the RSI looks like there is more room to head lower which indicates that more selling pressure could still be on the way.