
Ethereum has experienced a sharp rebound totaling 14.54% over the past 24 hours of trading. The cryptocurrency is now exchanging hands at around the $200 mark (at the time of writing), bringing the total losses over the past 7 trading days to 12%.
Ethereum was created in July 2015 by the young genius mind of Vitalik Buterin. It has commonly been described as a decentralized operating system which allows developers to code decentralized applications (dapps) on top of its blockchain. The developers have to code in Ethereum’s coding language known as Solidity, which allows them to integrate smart contracts in their dapps.
Over time, the Ethereum ecosystem has developed, with a large number of projects choosing to build their blockchain on the Ethereum network. This helps to increase the adoption rate of Ethereum as all projects issue ERC-20 tokens.
For more information on Ethereum, we recommend reading our “What is Ethereum” guide.
Ethereum is currently ranked 2nd in terms of overall market cap across the entire industry. It has a total market cap value of $20.24 billion after the 37-month old coins suffered a 61% price decline over the past 90 trading days. Ethereum is now a total of 85% down from its all-time high price.
Let us continue to analyze price action for Ethereum over the long run to get up-to-date with the market.
Ethereum Price Analysis
ETH/USD – LONG TERM – DAILY CHART

Analyzing the market from the long-term perspective above, we can see that Ethereum had experienced a major bullish run towards the second half of 2017 when price action started from a low of $198 on September 15, 2017 and extended to an all-time high (ATH) price of $1,424 on January 13, 2018. This was a price increase totaling 585% from low to high.
We can see that after placing the ATH, price action rolled over and began to decline significantly. It had originally found support at the .382 Fibonacci Retracement level priced at $956 during January 2018. This Fibonacci Retracement was measured from the entire second half of 2017’s bullish run outlined above.
Price action continued to decline as the year progressed, finding some form of support at the .618 Fibonacci Retracement priced at $666.90 in February 2018, before price action penetrated below in March 2018.
We can also see that during April 2018, price action had found support and rebounded at a upward sloping trend line (drawn as a dashed line). This upward sloping trend line formed the lower boundary of the long-term symmetrical triangle that had been forming throughout the trading year.
After rebounding from the lower boundary of the triangle, price action traveled higher to meet resistance at the upper boundary of the symmetrical triangle (drawn as a black downward sloping line) during May 2018.
The market rolled over and continued lower during June and July 2018. We had expected the lower boundary of the symmetrical triangle to provide support for the market at this time. However, during August 2018, the market plummeted below the lower boundary of the symmetrical triangle, pushing the market to further yearly lows.
As September began trading, price action depreciated even further, pushing the market below the initial starting level of the 2017 bullish run outlined above.
Let us continue to analyze price action a little closer over the shorter period to highlight any potential support and resistance areas.
ETH/USD – SHORT TERM – DAILY CHART
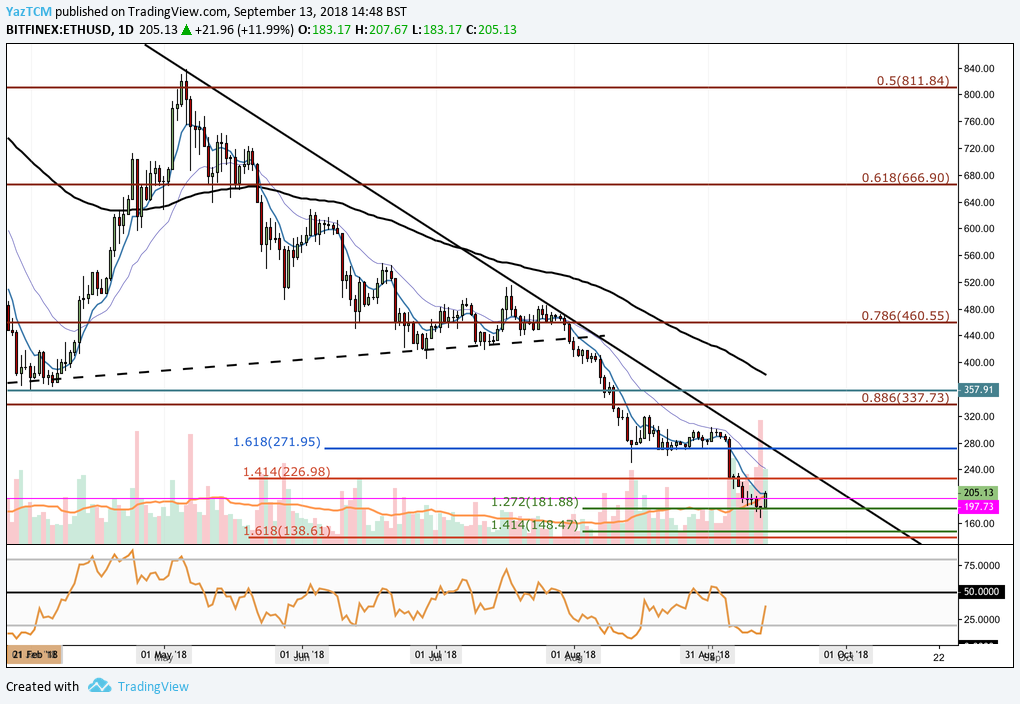
Analyzing the market from the perspective of a shorter time horizon, we can see that after the price action broke below our symmetrical triangle in August 2018, the market had found some form of relatively strong support at a downside 1.618 Fibonacci Extension level (drawn in blue) priced at $271.95.
We can see that the market had held at this support for a period of around 3 weeks before price action penetrated beneath and headed lower during September 2018.
The market continued further lower, breaking below the $198 starting handle of the 2017 bull run, causing the market to trade at lows not seen for over 14 months.
We can see that price action has recently found some form of support at a short-term downside 1.272 Fibonacci Extension level (drawn in green) priced at $181.88. The market had recently found relatively significant support at this level and rebounded.
If the recently activated bullish momentum continues within the market, we expect immediate resistance to be located at a downside 1.414 Fibonacci Extension level (drawn in red) priced at $226, followed by significant resistance at the previous downside 1.618 Fibonacci Extension level (drawn in blue) priced at $271.
If the market can continue even higher, further resistance will then be expected at the long-term downward sloping trend line which previously formed the upper boundary of our (now) broken symmetrical triangle. Resistance above this level can then be expected at the psychological round number handle of $300, followed by the long-term .886 Fibonacci Retracement level priced at $337.
Alternatively, if the dominating bearish pressure re-enters the market and pushes price action back lower, we expect immediate support to be located at the short-term downside 1.272 Fibonacci Extension level (drawn in green) priced at $181.88. Further support below this level can then be expected at the psychological round number handles of $175, followed by $150.
If the market continues even further lower than this, more support is then expected at the short-term downside 1.414 Fibonacci Extension level (drawn in green) priced at $148.47, followed by the longer-term downside 1.618 Fibonacci Extension level (drawn in red) priced at $138.61.
The technical indicators within the market are currently heavily favoring the bears at this moment in time, as the RSI trades well below the 50 handle which indicates that the bearish momentum is solidly in control.
For a sign that the bearish momentum is beginning to fade within the market, we will be looking for the RSI to make its way back toward the 50 handle. A sustained break above the 50 handle could signal the start to a bullish run as the RSI has not managed to remain above 50 for an extended period of time since May 2018.
Let us continue to quickly analyze price action for Ethereum relative to Bitcoin over the long term and highlight any potential long-term support and resistance areas.
ETH/BTC – LONG TERM – DAILY CHART
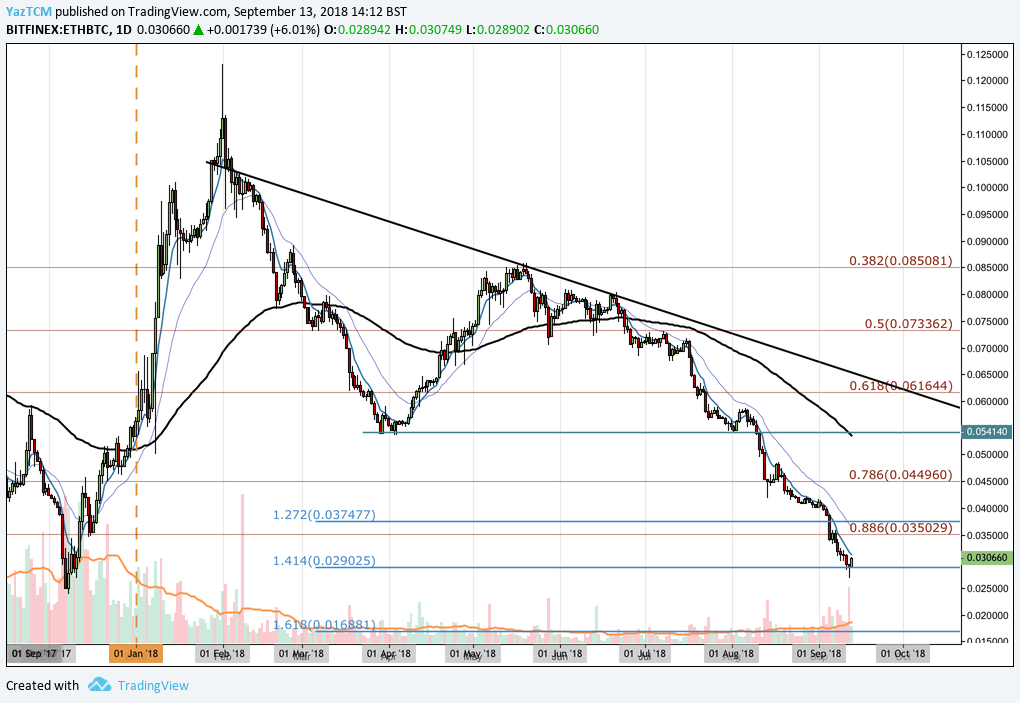
Analyzing the market relative to Bitcoin over the long term, we can see that price action had experienced a major bullish run toward the end of 2017 when the market started from a low of 0.023900 SATS on December 8, 2017 and extended to an ATH price of 0.1230 SATS on February 1, 2018. This was a price increase totaling 427% from low to high.
We can see that price action has been falling aggressively throughout the entire year of 2018 and has nearly completed a 100% Fibonacci Retracement of the bullish run outlined above.
The market has recently found some form of support at a long-term downside 1.414 Fibonacci Extension level priced at 0.029025 SATS. We can see that price action has recently reversed from this level of support.
If the market continues to rally higher, we expect immediate resistance to be located at the .886 Fibonacci Retracement level priced at 0.035029 SATS, followed by the downside 1.272 Fibonacci Extension level priced at 0.037477 SATS.
Alternatively, if the market continues further lower and penetrates below the support at 0.029025 SATS, we expect immediate support below to be located at the psychological round number handle of 0.025 SATS, followed by the initial starting price level of the 2017 bull run priced at 0.023900 SATS.
Related: Why Ethereum Supporters Should Be Watching Loom Network