
- Ethereum has seen a recent price surge totaling over 10% over the past week of trading.
- The market is now trading at the upper boundary of a short-term symmetrical triangle pattern.
- Support moving forward: $212, $202, $200, $197, $190, $188, $181, $180, $167.
- Resistance moving forward: $222, $226, $234, $250, $260, $271, $290, $300, $308.
Ethereum has seen a 1.79% increase in price over the previous 24-hour trading session as the cryptocurrency now is trading hands at a price around $220, at the time of writing. The market has undergone a further 10.72% price surge over the past 7 trading days, as price action breaks back above the $200 handle once again.
Ethereum is still ranked in 2nd position in terms of overall market cap across the entire industry, holding a total market cap of $22.53 billion. Despite the recent price rise, the market has still suffered a rough 90-day stint as price action dropped 40% over this period.
The 30-month old coin is now trading at a level that is 84% lower than its all-time high price.
Let us continue to analyse price action for ETH over the long term and see how the market has been behaving.
Ethereum Price Analysis
ETH/USD – LONG TERM – DAILY CHART
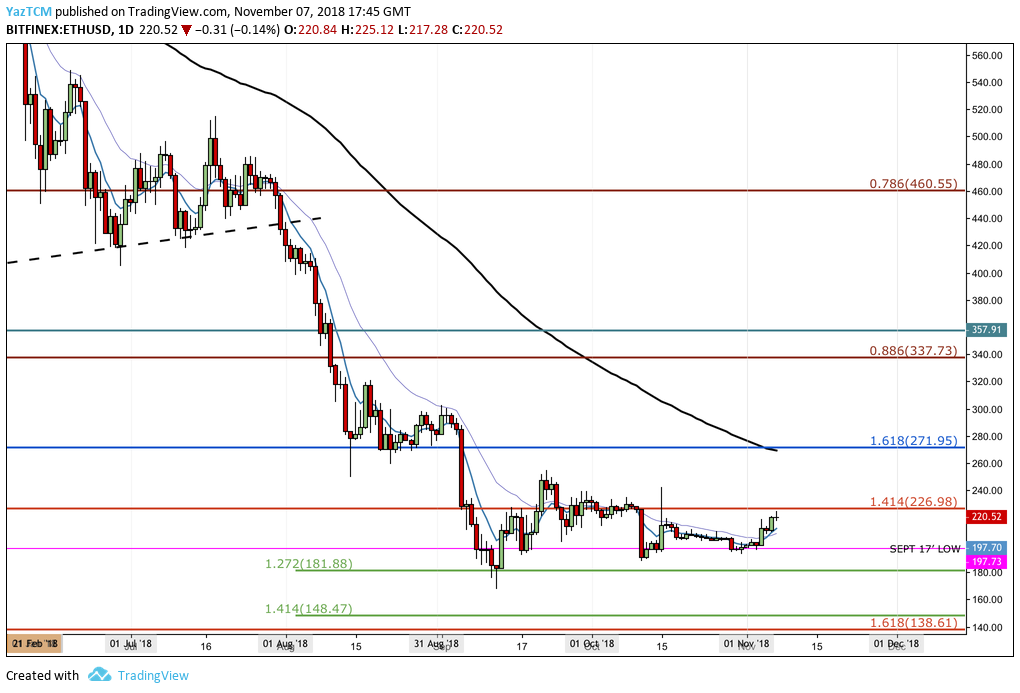
From the long-term perspective above, we can see that price action has continue to trade sideways since our last analysis piece on Ethereum.
The market had stalled its previous decline after reaching support at a highlighted downside 1.272 Fibonacci Extension level (drawn in green) priced at $181.88. The market has not re-tested this level since rebounding from the support.
We can also see that higher significant support was provided by the September 2017 price low at $197.73 during both October and November 2018.
The recent price surge over the past week has now seen ETH/USD rise into resistance provided by a previous long-term downside 1.414 Fibonacci Extension level (drawn in red) priced at $226.98.
Let us continue to analyze ETH/USD price action a little closer over the short term and highlight any areas of potential support and resistance moving forward.
ETH/USD – SHORT TERM – DAILY CHART
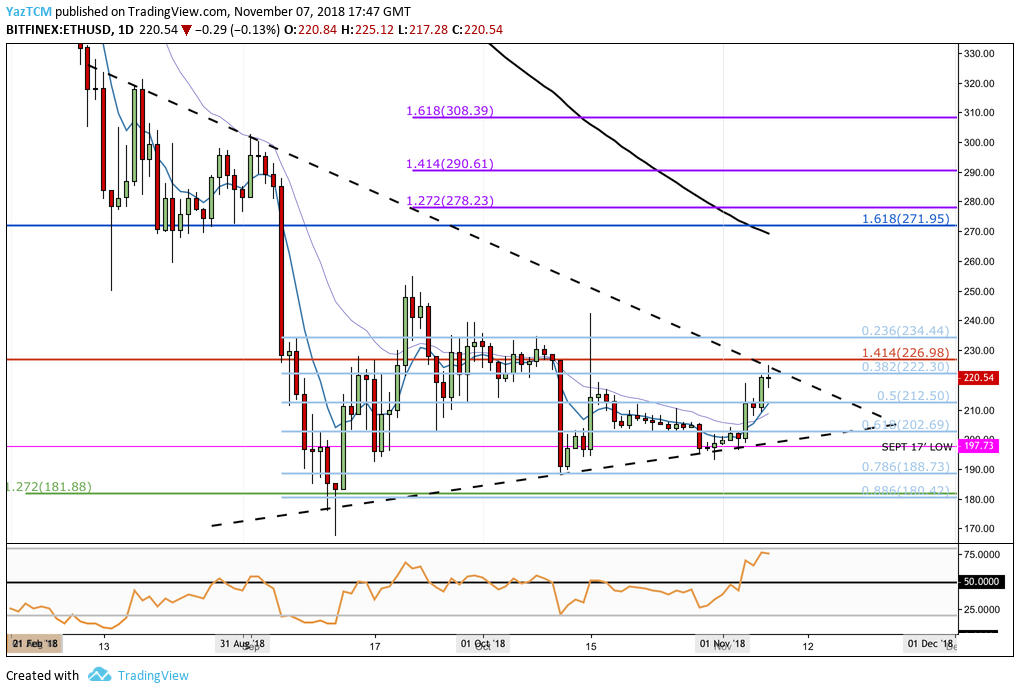
Analyzing ETH/USD with the benefit of a closer perspective, we can see that price action saw a hike when the market started from a low of $167.32 on September 12, 2018 and continued to rise to a high of $255 on September 22, 2018. This was a price increase of 52% from low to high.
The ETH/USD market then went on to decline until support was found at the short-term .786 Fibonacci Retracement level (drawn in light blue) priced at $188.73 during October 2018. It is also important to highlight that this level of support was further reinforced by the lower boundary of the symmetrical triangle that has been forming since price action rebounded from $181.88.
Price action for ETH/USD is now trading at resistance provided by the upper boundary of the symmetrical triangle which is also further boosted by resistance at the .382 Fibonacci Retracement level (drawn in light blue) priced at $222.30.
Moving forward, in our bullish scenario, if the buyers can climb up above the confines of the symmetrical triangle and above resistance at $222, we can expect immediate resistance above to be located at the previous long-term downside 1.414 Fibonacci Extension level (drawn in red) priced at $226.98, followed by the short-term .236 Fibonacci Retracement level (drawn in blue) priced at $234.44.
If the bulls can then continue to break above the September 2018 high at $255, then we can look for further higher resistance to be located at the previous downside 1.618 Fibonacci Extension level (drawn in dark blue) priced at $271.95.
This price level had provided significant support for the market during August 2018 and is expected to provide a similar level of resistance moving forward (old support now becomes new resistance). The 100-day moving average is also trading just below this level, further adding to the strength of the expected resistance within this area.
The final 2 levels of resistance to highlight above are located at the short-term 1.414 and 1.618 Fibonacci Extension levels (drawn in purple), priced at $290 and $308 respectively.
Alternatively, in our bearish scenario, if the ETH/USD market fails to break above the symmetrical triangle and pulls back again, we can expect immediate support beneath to be located at the short term .5 and .618 Fibonacci Retracement levels (drawn in light blue) priced at $212 and $202 respectively.
Support located beneath this can then be expected at the lower boundary of the symmetrical triangle in play.
If the sellers drive price action below the triangle and below $200, we can expect immediate support beneath to be located at the September 2017 price low at $197.73, followed by the short-term .786 Fibonacci Retracement level (drawn in light blue) priced at $188.73. If the selling continues even further lower, more support can then be expected at $181.88, followed by the September 2018 low priced at $167.32.
The RSI is producing a reading that favors the buyers at this moment in time as it currently trades above the 50 handle. As the RSI is close to overbought conditions, the market may to pull back slightly before being able to continue with its bullish run.
Let us continue to quickly analyze price action for Ethereum against Bitcoin over the long term.
ETH/BTC – LONG TERM – DAILY CHART
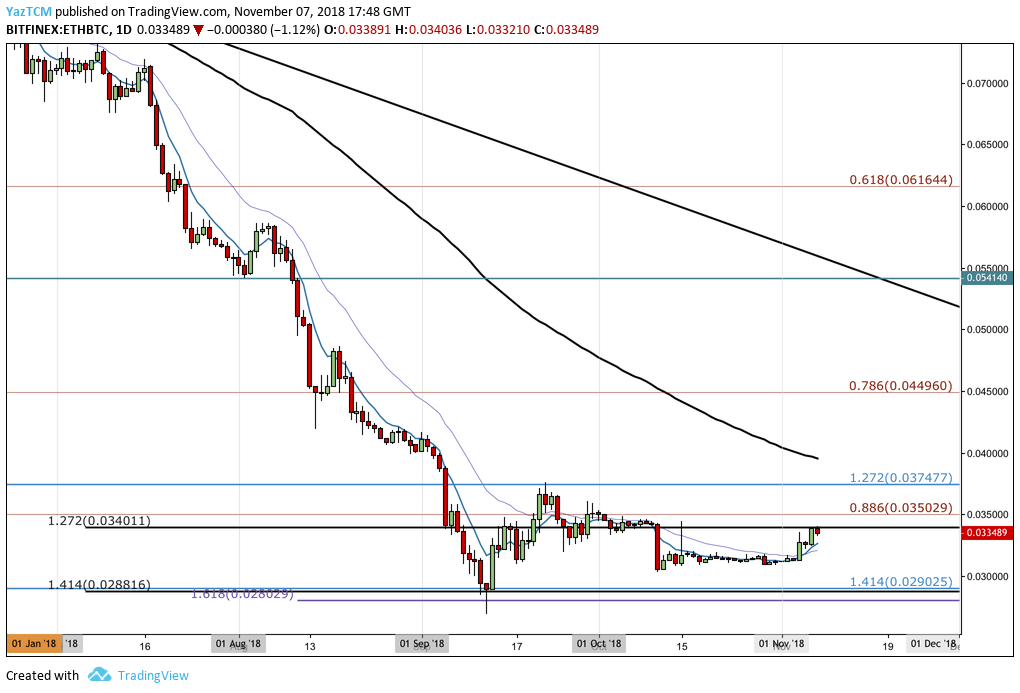
Analyzing price action for ETH/BTC, we can see that the long and steep price decline had reached support during September at a combined area of support which contained many downside Fibonacci Extension levels around the 0.028816 SATS handle.
As ETH/BTC reached this level, the market rebounded slightly, and then continued to trade sideways. We can see that price action is now trading at resistance provided by the downside 1.272 Fibonacci Extension level (drawn in black) priced at 0.034011 SATS.
Let us take a closer look at price action for ETH/BTC over the shorter period.
ETH/BTC – SHORT TERM – DAILY CHART
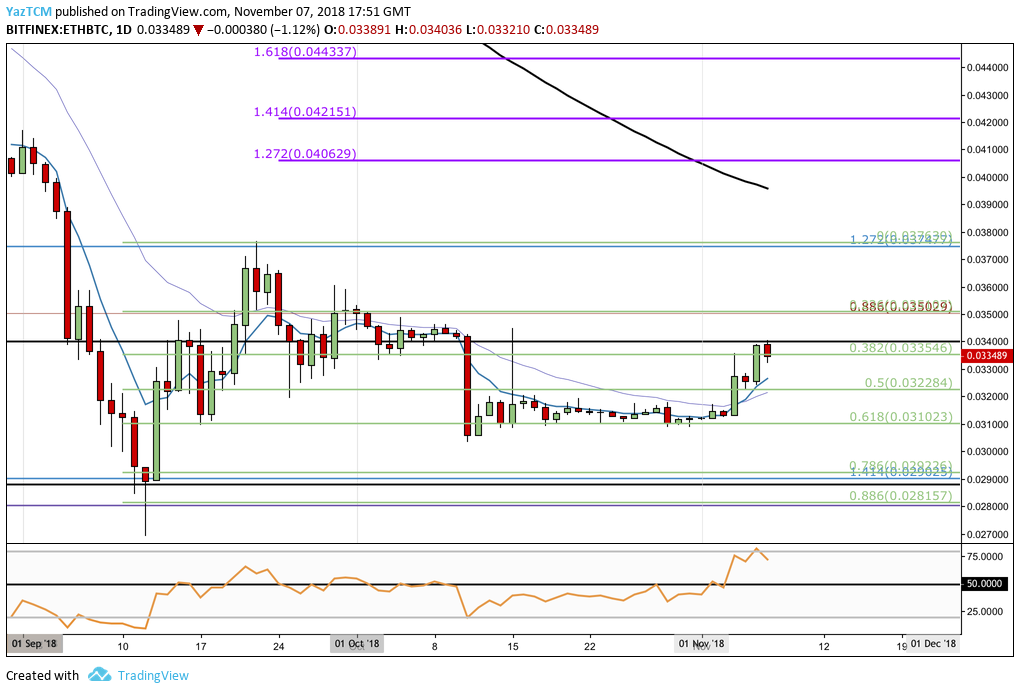
Inspecting price action for the market over a closer time horizon, we can see that after rebounding, the market went on to produce a 38% increase in price. ETH/BTC started at a low of 0.026901 SATS on September 12, 2018 and rose to a high of 0.037649 SATS on September 22, 2018.
After reaching the high, the market rolled over and declined to find support below at the short-term .618 Fibonacci Retracement level priced at 0.031023 during October 2018. This price level supported the market very well during the second half of October 2018, preventing price action from dropping further lower.
Moving forward, if the bullish pressure continues to push ETH/BTC above resistance at 0.034011 SATS, we can expect immediate higher resistance to be located at the .236 Fibonacci Retracement level priced at 0.035029 SATS, followed by the September 2018 high priced at 0.037649 SATS.
If the buyers can continue to drive price action further higher, we can then expect resistance above to be located at the 1.272 and 1.618 Fibonacci Extension levels (drawn in purple), priced at 0.040629 SATS and 0.044337 SATS respectively.
On the other hand, in our bearish scenario, if the sellers regroup and push price action lower, we can expect immediate support beneath to be located at the .5 and .618 Fibonacci Retracement levels priced at 0.032284 SATS and 0.031023 SATS respectively.
Further support below this can be located at the .786 Fibonacci Retracement level priced at 0.029226, followed by the September 2018 low priced at 0.026901 SATS.