
- Ethereum Classic is currently trading at 20-month lows.
- The market has recently found some support at a downside 1.414 Fibonacci Extension level priced at $4.35.
- Support moving forward: $5.00, $4.29, $4.00, $3.50, $3.00, $2.74, $2.50, $2.00, $1.92.
- Resistance moving forward: $5.62, $6.00, $6.41, $6.99, $7.00, $7.83, $8.80, $9.39, $10.00.
Ethereum Classic has seen a small price hike totaling 4% over the past 24 hours of trading. The cryptocurrency is now trading at a price around $4.95, at the time of writing, after suffering a 7-day price decline totaling 13%.
Ethereum Classic is now ranked in 18th position, with a total market cap value of $526 million. The 28-month old Ethereum fork has undergone a very rough trading month, losing over 48% over the past 30 trading days.
Let us continue to take a look at ETC over the long term against the USD.
Ethereum Classic Price Analysis
ETC/USD – LONG TERM – DAILY CHART
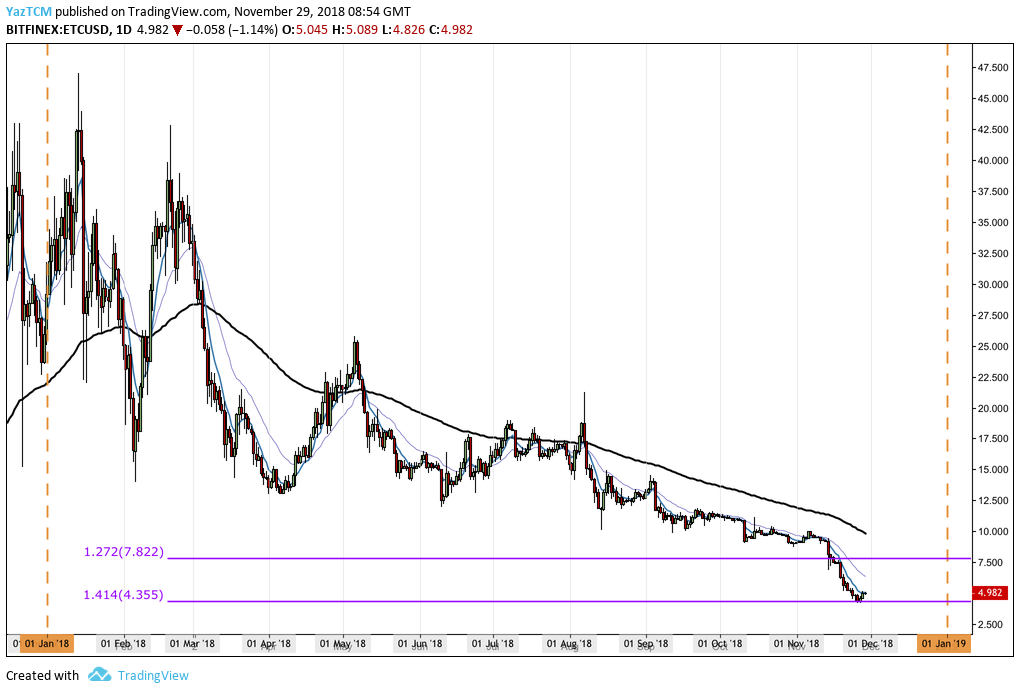
Taking a look at ETC/USD from the long-term perspective above, we can clearly see the disastrous year that the market has been through. The market has fallen from its 2018 high priced at $46.98 to its current catastrophic low around $4.98.
We can see that price action has recently found a form of long-term support provided by a downside 1.414 FIbonacci Extension level (drawn in purple) priced at $4.35.
Let us continue to take a look at the market from a closer perspective and highlight any potential areas of support and resistance moving forward.
ETC/USD – SHORT TERM – DAILY CHART
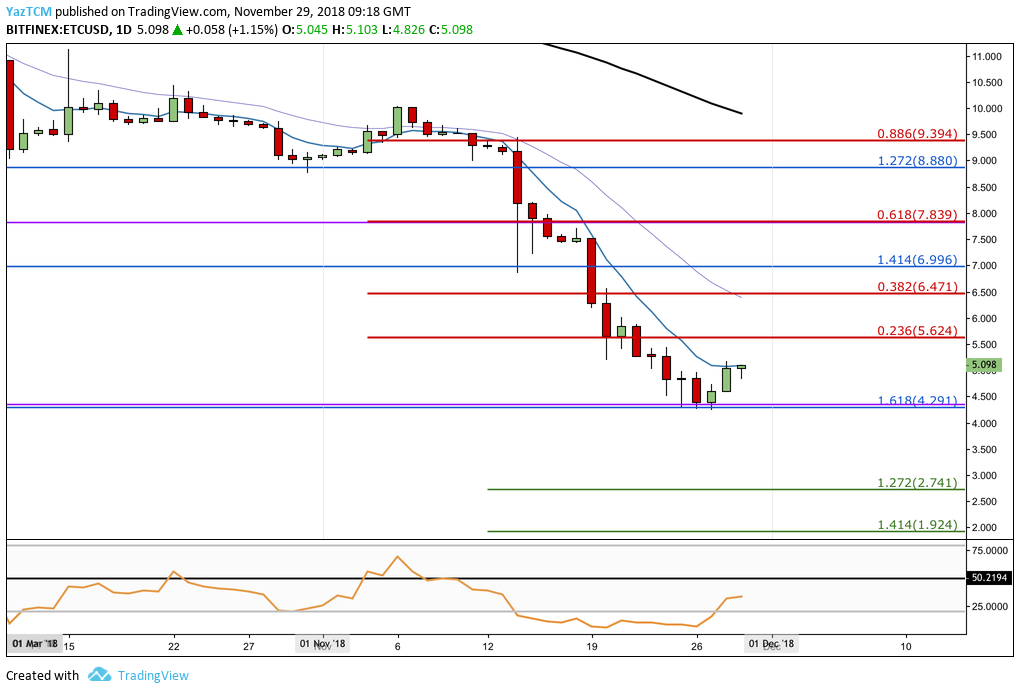
Upon closer inspection of ETC/USD, we can see that the support at $4.35 (outlined in the section above) is bolstered by a shorter-term downside 1.618 Fibonacci Extension level (drawn in blue) priced in the same region.
After a month of declining prices, this combined area of support has allowed ETC/USD to rebound marginally in an attempt to kickstart a recovery. The market is now trading at resistance provided by the 7-day EMA (blue moving average) around the $4.99 handle.
Moving forward, if the buyers can continue with their recovery and push the market higher, we can expect immediate resistance above to be located at the short-term bearish .236 Fibonacci Retracement level (drawn in red) priced at $5.62.
Further significant resistance above this can then be expected at the short-term bearish .382 Fibonacci Retracement level (drawn in red) priced at $6.47. This area of resistance is further strengthened by the 21-day EMA (purple moving average) which is currently hovering within the same area.
If the bullish momentum continues higher, more resistance above will then be located at the previous downside 1.414 Fibonacci Extension level (drawn in blue) priced at $6.99, followed by the short-term .618 Fibonacci Retracement level (drawn in red) priced at $7.83. The resistance at $7.83 will require significant momentum to overcome due to the previous long-term downside 1.272 Fibonacci Extension level (drawn in purple) also being located within this area.
On the other hand, in our bearish scenario, if the market rolls over once again and begins to decline, we can expect immediate support below to be located at the previous combined support at the downside 1.618 Fibonacci Extension level (drawn in blue) priced at $4.29.
If the sellers continue to drop further below this combined area of support at $4.29, further support below can be located at the short-term downside 1.272 FIbonacci Extension level (drawn in green) priced at $2.74.
The RSI has started its journey back toward the 50 handle as the bulls battle to regain control of the market momentum. A break above the 50 handle would confirm that the bulls are back in control of the market momentum.
Let us continue to analyze price action ETC/BTC over the long term.
ETC/BTC – LONG TERM – DAILY CHART
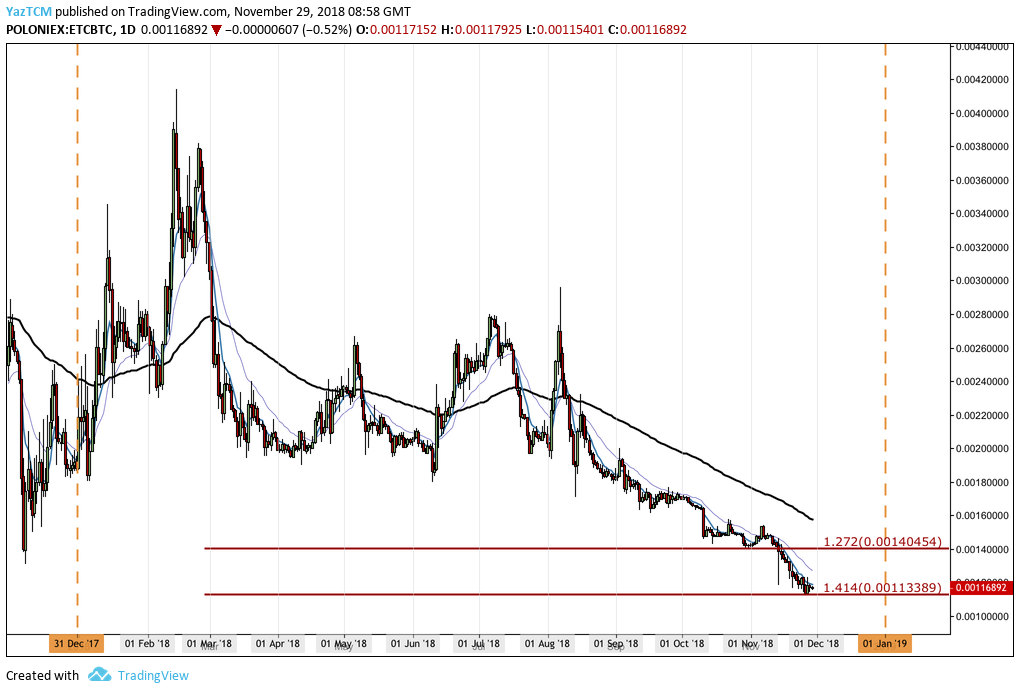
Analyzing ETC/BTC from the long-term perspective above, we can see a similarly depressing year for ETC against BTC. Price action has been consistently falling for the majority of the trading year, and has recently established fresh yearly lows for 2018.
Price action has approached a form of long-term support provided by the long-term downside 1.414 FIbonacci Extension level (drawn in red) priced at 0.00113389 SATS. It is too early to confirm the validity of this support level but due to its long-term nature, we can assume that the market will experience relatively strong support within this area.
Let us take a closer look at the market over the past couple of months and highlight any potential areas of support and resistance.
ETC/BTC – SHORT TERM – DAILY CHART

From the short-term chart above, we can see that the support at the downside 1.414 Fibonacci Extension level (mentioned above) is also bolstered by another shorter-term downside 1.414 Fibonacci Extension level (drawn in orange) priced in the same area.
If the sellers manage to penetrate below this combined level of support, support below can be expected at the downside 1.272 and 1.414 Fibonacci Extension levels (drawn in purple), priced at 0.00102945 SATS and 0.00097244 SATS respectively.
Alternatively, for our bullish expectations, if the buyers begin to cause the market to climb higher, we can expect immediate significant resistance above to be located at the previous short-term downside 1.272 FIbonacci Extension level (drawn in orange) priced at 0.00130053 SATS.
This is closely followed by the long-term downside 1.272 Fibonacci Extension level (drawn in red) priced at 0.00140454 SATS.
The RSI within this market has also started to rise up out of oversold conditions. However, it seems to be struggling to make its way back to the 50 handle as it zigzags around the 30 level.
If the RSI continues to climb higher, this may indicate that the bears are losing interest in selling the market and a strong recovery may be possible.