
EOS has seen a small price increase totaling 0.20% over the past 24 hours of trading. The cryptocurrency is currently exchanging hands at around $5.66, after seeing a further well-sought after price increase totaling 9.15% over the past 7 trading days.
EOS, the cryptocurrency created by Dan Larimer, has commonly been described as the most powerful infrastructure for decentralized applications. It is a decentralized operating system, similar to Ethereum, which allows developers to program smart contract dapps on top of its blockchain.
The transactions per second (TPS) capable from EOS is significantly higher than its competition. EOS can currently handle a maximum of 3,996 TPS, compared to the 20 TPS capable from Ethereum.
For more information on EOS, take a look at “6 Reasons to Invest in EOS”.
EOS is currently ranked 5th in terms of overall market cap across the entire industry. It currently has a total market cap value of $5.13 billion after the 15-month old coin saw a 34% price drop over the past 90 trading days. EOS is currently trading at a price that is 73% lower than its all-time high value.
Let us continue to analyze EOS over the long term and see how the market has been trading.
EOS Price Analysis
EOS/USD – LONG TERM – DAILY CHART
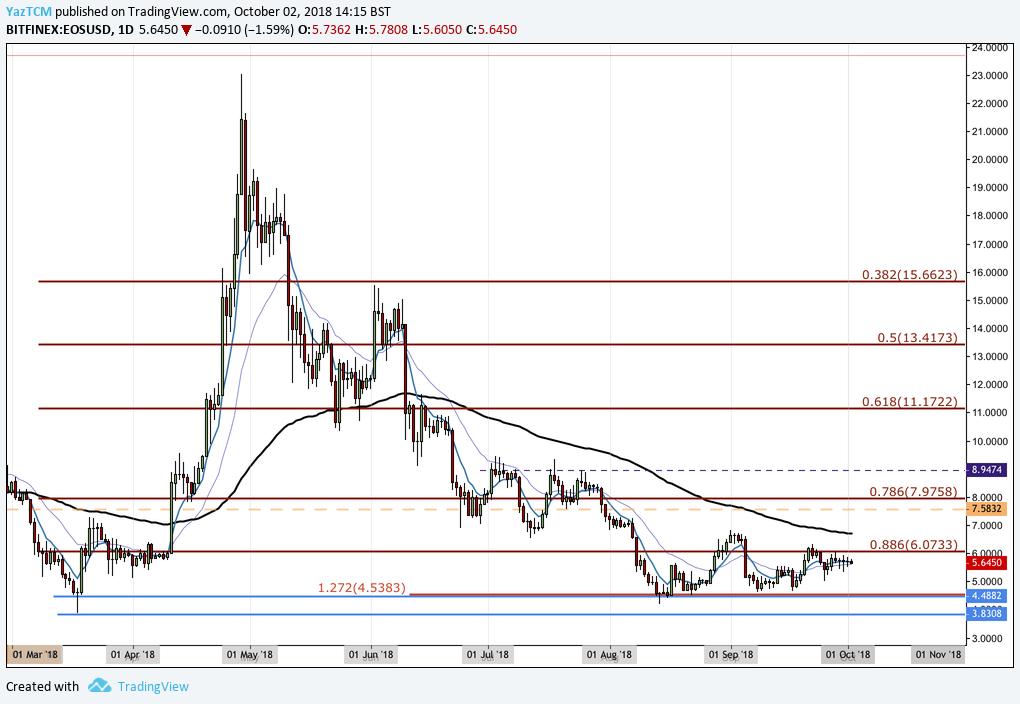
Analyzing the market from the long-term perspective above, we can see that EOS had experienced a bullish run when the market started from a low of $3.87 on March 18, 2018 and extended to an all-time high (ATH) price of $23.02 on April 29, 2018. This was a price increase totaling over 500% from low to high.
After placing the ATH, price action rolled over and began to decline. It had originally found some form of support at the .618 Fibonacci Retracement level priced at $11.17 during May 2018. This Fibonacci Retracement is measured from the entire bullish run outlined above.
As the year progressed, price action continued to fall steadily, finding more support at the .786 Fibonacci Retracemenet level priced at $7.97 during June and July 2018. However, as the market bloodbath began to unravel in August 2018, price action fell even lower.
We can see that the market continued to drop until finding support at a long-term downside 1.272 Fibonacci Extension level priced at $4.53.
This level of support was further bolstered by the low day close price seen during March 2018 which added to the expected support in this area. As the market approached this level, it was stabilized and began to trade sideways. Price action is now currently trading just below resistance marked by the .886 Fibonacci Retracement level priced at $6.07.
Let us continue to analyze price action a little closer over the short term and continue to highlight any potential support and resistance zones.
EOS/USD – SHORT TERM – DAILY CHART
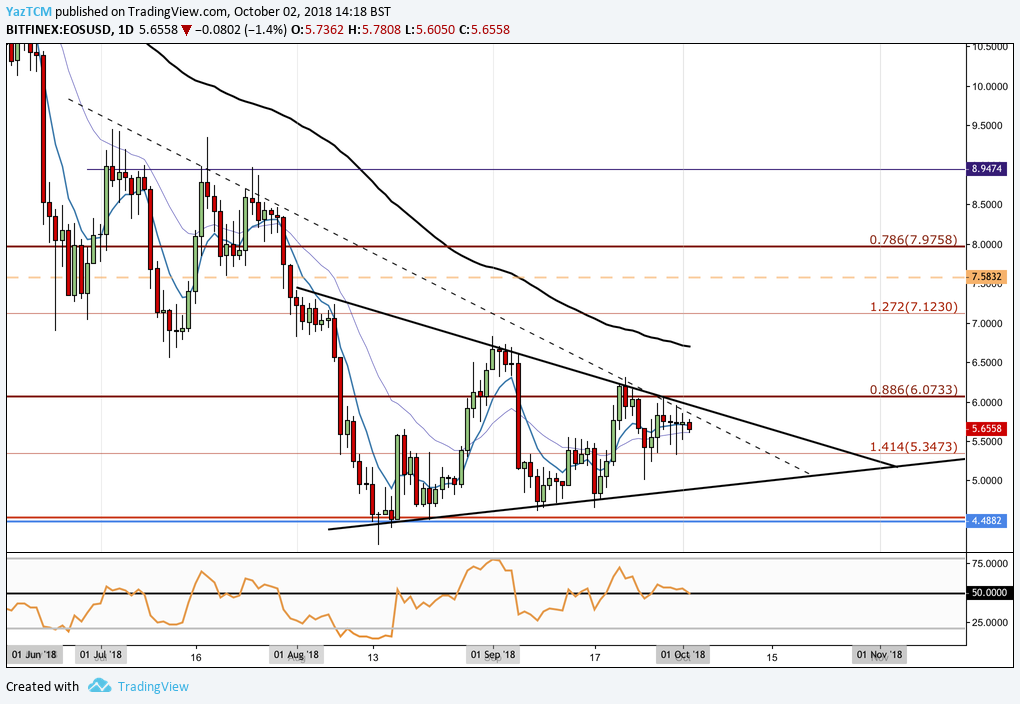
Analyzing the market from the benefit of a closer perspective, we can see that over the past 2 trading months, price action has been establishing a symmetrical triangle trading pattern. We can clearly see the triangle characterized by the falling upper boundary and the rising lower boundary.
It is also important to highlight that there are in fact 2 triangles.
The longer-term triangle is drawn with a dotted line as the shorter-term triangle appears to have more validity. However, both triangles are active and in progress. Typically, a triangle will resolve itself as it approaches the apex. We can see that the apex of this triangle is rapidly approaching as speculators anticipate an upside break to mark a new potential bullish run for EOS.
Moving forward, if the bears pressure the market action lower, we can expect immediate support at the short-term downside 1.414 Fibonacci Extension level priced at $5.43.
Support located below this will then be expected at the lower boundary of the symmetrical triangle. If the bears do indeed push price action below the confines of the triangle, then we can expect immediate significant support below to be located at the previous long-term downside 1.272 Fibonacci Extension level priced at $4.53.
Alternatively, if the bulls can regather momentum and pressure price action higher, we can expect immediate resistance to be located at the upper boundaries of the trading triangles (both of them). If the bulls can finally break out towards the upside, then we can expect more resistance to be located at the .886 Fibonacci Retracement level priced at $6.07.
If the bullish momentum continues even higher, then more resistance will then be expected at the 100-day moving average which is currently hovering around the $6.70 handle, followed by the yearly opening price at $7.58.
Significant resistance above this level can then be expected at the .786 Fibonacci Retracement level priced at $7.97, followed by the psychological round number handle of $9.00.
The technical indicators within the market are currently printing neutral readings. The RSI is currently trading directly on the 50 handle, indicating the indecision within the market.
If we would like to see an upside break of the triangle, then we would need to witness the RSI breaking above the 50 handle to indicate that the bulls are in control of the momentum within the market.
Let us continue to quickly analyze price action for EOS relative to BTC over the long term.
EOS/BTC – LONG TERM – DAILY CHART
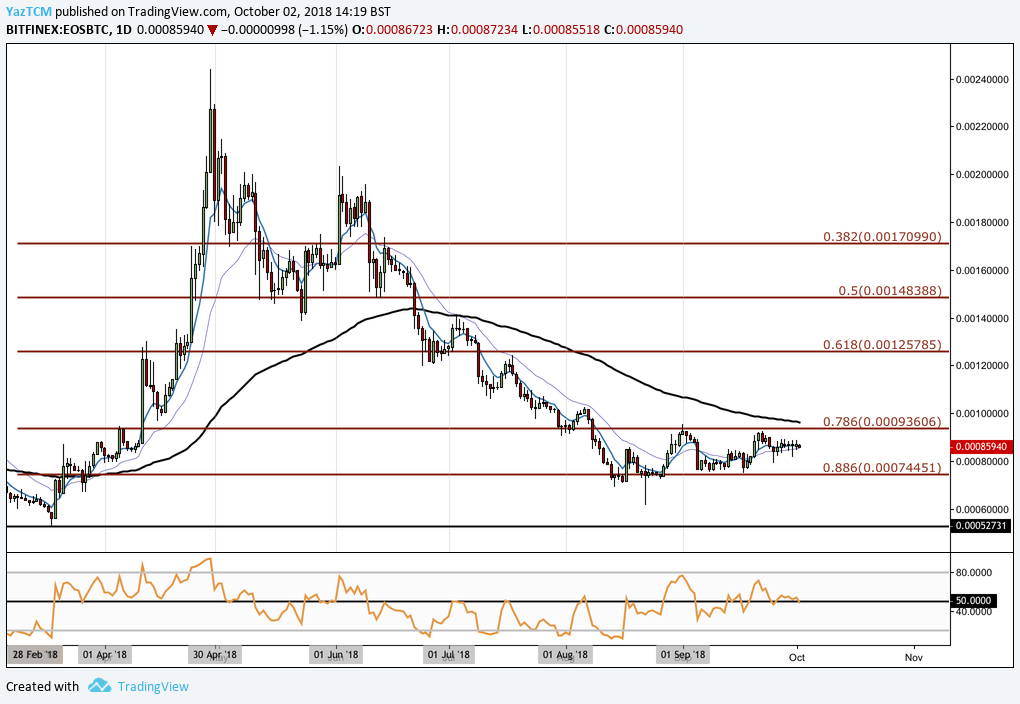
Analyzing price action from the long-term perspective above, we can see that EOS had experienced a bullish run against BTC when the market started from a low of 52,898 SATS on March 18, 2018 and extended to a high of 243,860 SATS on April 29, 2018. This was a price increase totaling 355% from low to high.
After placing the high, price action rolled over and began to decline. We can see that it had originally found some support at the .5 Fibonacci Retracement level priced at 148,388 SATS during April 2018. However, the bearish pressure was too overpowering for the bulls and the market continued to decline throughout the year.
We can see that price action had found some relatively strong support at the .886 Fibonacci Retracement level priced at 74,451 SATS during August 2018. As the market reached this level of support, the bearish trading conditions ceased as the market began to move sideways.
Since mid-August 2018, price action has been trapped within a very narrow range bound between the .886 Fibonacci Retracement priced at 74,451 SATS as the lower boundary of the range and the .786 Fibonacci Retracement priced at 93,606 SATS as the upper boundary of the range.
If the bulls can regather momentum and push price action higher, we expect immediate resistance to come in at the upper boundary of the range. The resistance here will be significant due to the 100-day moving average trading directly above the upper boundary, further adding to the expected resistance.
If the bulls can break up above the upper boundary of the range, we can expect immediate resistance to be located at the .618 Fibonacci Retracement level priced at 125,785 SATS, followed by the .5 Fibonacci Retracement level priced at 148,388 SATS.
The technical indicators within this market are also producing neutral readings indicating the indecision among traders. If we would like to see EOS break above the range, we would need to see the RSI rise above the 50 handle.