
Emercoin had seen a promising 15% price rise during yesterday’s trading session as the cryptocurrency managed to reach a high of $1.92 during the period. Since placing this high, the cryptocurrency has pulled back slightly to leave a +0.24% price hike over the past 24 hours of trading, at the time of writing.
EMC is currently exchanging hands at a price of $1.74, after experiencing a rough price drop totaling 15% over the past 7 trading days.
Emercoin is one of the oldest in the top 100 ranked coins by market cap. Launched in 2013 by Eugene Shumilov, Emercoin has grown and secured fantastic partnerships with companies such as Deloitte, Microsoft and BitFury.
It is described as a distributed blockchain that is geared toward business and enterprise use cases. It is unique in the sense that it allows users to code programs and develop application suites in an easy-to-use process for all skill levels. The Emercoin team has provided a range of dSDKs (decentralized Software Development Kits) for coders to be able to start creating their applications.
The consensus mechanism that the Emercoin network has elected to use is a combination of PoS and PoW, allowing the network and users to benefit from the added security and distribution method.
Emercoin provides a wide range of services relating to privacy, security micro payments and data exchange, such as:
- EMCSSH – providing a high level of shell protection to the network
- EMCDNS – allows for the support of SSL certificates
- EMCSTREAM – digital media library based off of micropayments
- EMCLNX – a peer-to-peer text based advertising link network
Emercoin is currently ranked 78th in terms of overall market cap across the entire industry. The 48-month old coin has a total market cap value of $73 million and has suffered a 43% drop over the past 30 trading days.
Let us continue to analyze price action for EMC/USD over the long term.
Price Analysis: Emercoin
EMC/USD – LONG TERM – DAILY CHART
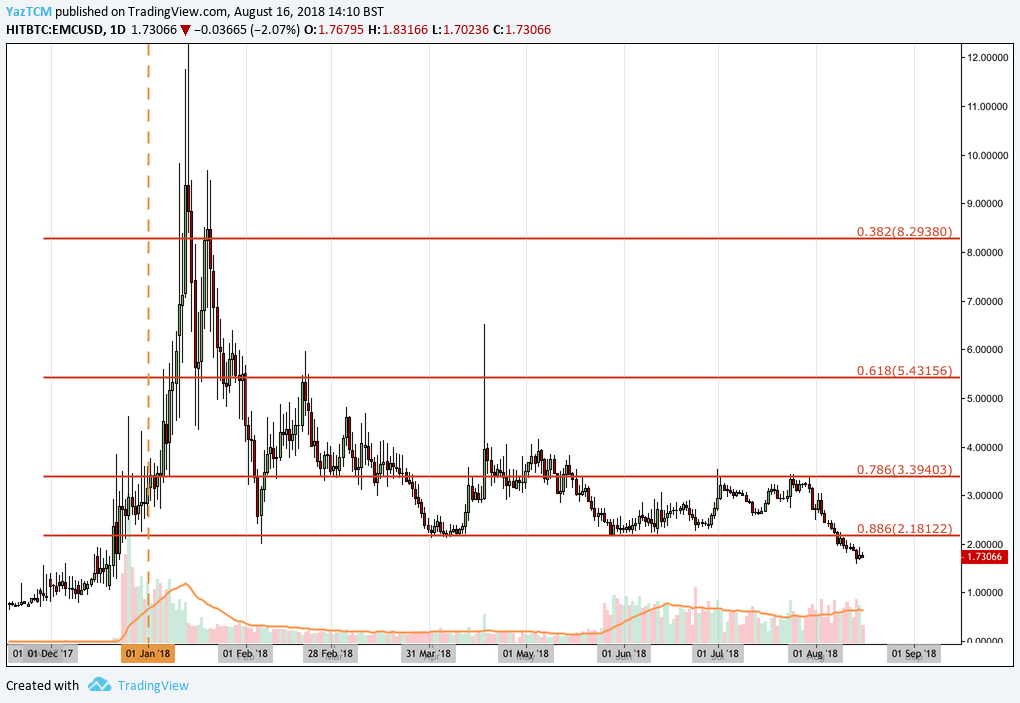
Analyzing the market from the long-term horizon above, we can see that EMC had experienced an incredible bullish run toward the end of 2017. This bullish run began when price action started from a low of $0.78 on December 10, 2017 and extended to an all-time high of $12.96 placed on January 14, 2018. This was a price increase totaling over 1,500% from low to high.
We can see that after placing the high, price action began to rapidly decrease, originally finding support at the .618 Fibonacci Retracement priced at $5.17 during January 2018. This Fibonacci Retracement is measured from the entire bullish run outlined above.
Price action continued to decline throughout February and March where support was found, for the most part, at the .786 Fibonacci Retracement priced at $3.39. The market fell below this during April and continued to fall until support was found at the .886 Fibonacci Retracement priced at $2.18. This provided a solid foundational support for the following months as price action tested this area and failed to break below it during both May and June.
However, as the industry bloodbath started during August, price action fell further below this long-term support highlighted by the .886 Fibonacci Retracement, and proceeded to dip below the $2 handle.
Let us continue to analyze price action a little closer over the short term to highlight any potential support and resistance areas.
EMC/USD – SHORT TERM – DAILY CHART
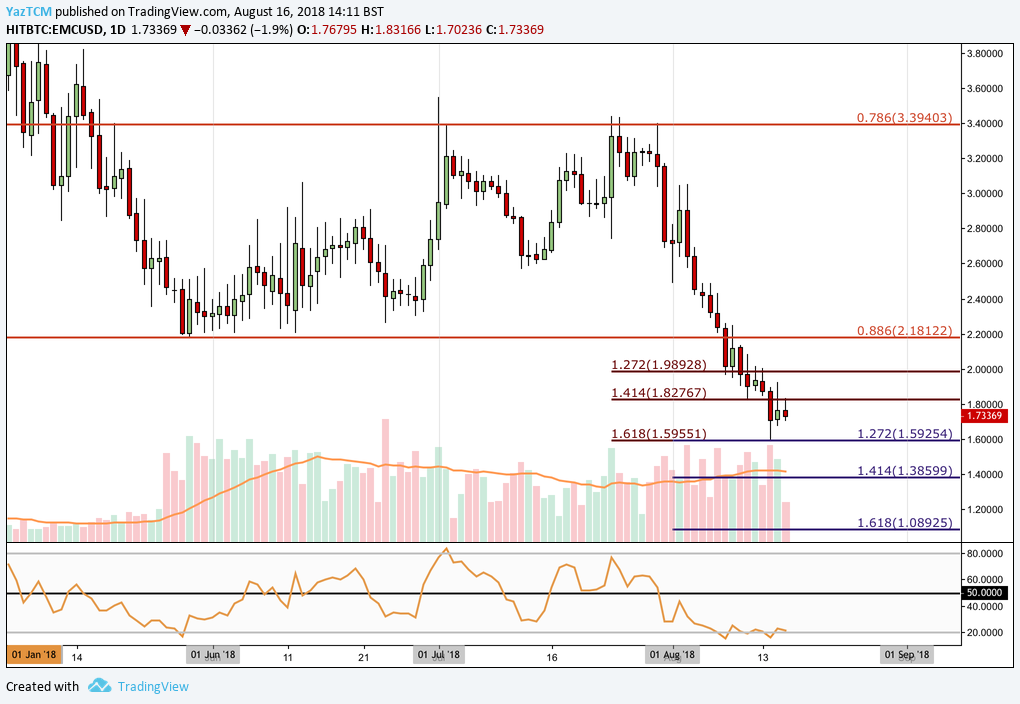
Analyzing the market from a short-term time horizon above, we can see that during June and July, price action had been trapped within a range-bound condition between the .786 Fibonacci Retracement, marking the upper boundary and the .886 Fibonacci Retracement, marking the lower boundary.
We can see that as August began trading, price action fell below the lower boundary of this trading range and continued on its bearish trajectory. We can see that brief support was found at both the short-term downside 1.272 Fibonacci Extension, priced at $1.98 and the 1.414 Fibonacci Extension priced at $1.82 (both drawn in red).
The market continued to fall further lower until recently finding support at the short-term 1.618 Fibonacci Extension (drawn in red) priced at $1.59, where a rebound was experienced. This area of support is also bolstered by a shorter-termed downside 1.272 Fibonacci Extension (drawn in blue) priced in the same area. We are currently now trading at resistance marked by the previous downside 1.414 Fibonacci Extension priced at $1.82.
If the bulls can push market action above the $1.82 handle, we expect immediate resistance to be located at the $2.00 psychological round number handle. Resistance above this area is expected at the long-term .886 Fibonacci Retracement level priced at $2.18.
Alternatively, if the bears continue and regain their dominance within the market, we expect immediate support to be located at the shorter-termed downside 1.272 Fibonacci Extension level, priced at $1.59. Support located below this level can be located at the downside 1.414 Fibonacci Extension level priced at $1.38, followed by the downside 1.618 Fibonacci Extension level priced at $1.08 (both drawn in blue).
The technical indicators are a largely favoring the bearish case at this current moment within the market. The RSI is trading at extreme oversold conditions marked below the 20 handle. It has been trading in extreme oversold conditions throughout the majority of August.
For a sign that the bearish momentum is beginning to fade within the market, we will be looking for the RSI to make its way back toward the 50 handle. A sustained break above 50 would be the first signal that the bulls are starting to regain some momentum within the market.