DigiByte has witnessed a strong 8.27% increase in price over the last 24 hours of trading. The cryptocurrency trades at $0.0432, at the time of writing and has enjoyed a price hike of 10.65% over the past 7 trading days. The significant price increase of 64.59% over the last 30 trading days puts DigiByte amongst the top performers this month in terms of value, out of the top 100 ranked coins.
DigiByte was created by Jared Tate in January 2014 and was created to become a “more secure, faster and forward thinking blockchain.” It could be said that DigiByte has achieved this in some areas against Bitcoin such as its 15-second block time, compared with 10 minutes from Bitcoin. DigiByte also shadows Bitcoin’s current 7 transactions per second (TPS), clocking in around 500 TPS — the team expects this figure to be around 2,000 TPS by 2020.
DigiByte also boasts a new multi-algorithm mining codebase which allows users to mine DGB in various ways, adding to the security of DGB. Over the 4 and a half years that DigiByte has been running, it has achieved many accomplishments as well as endorsements, most notably from John McAfee who included DGB in his “coin of the day” segment.
For a more in depth overview of DGB we recommend our “What is DigiByte” guide.
DigiByte is currently ranked 33rd in terms of overall market cap across the entire industry, with a total market cap value of $455 million. This is a significant $833 million lower than the market cap high of $1.288 billion seen on January 6, 2018.
Let us continue to analyze DGB market action over the long period.
Price Analysis
DBG/USD – LONG TERM – DAILY CHART
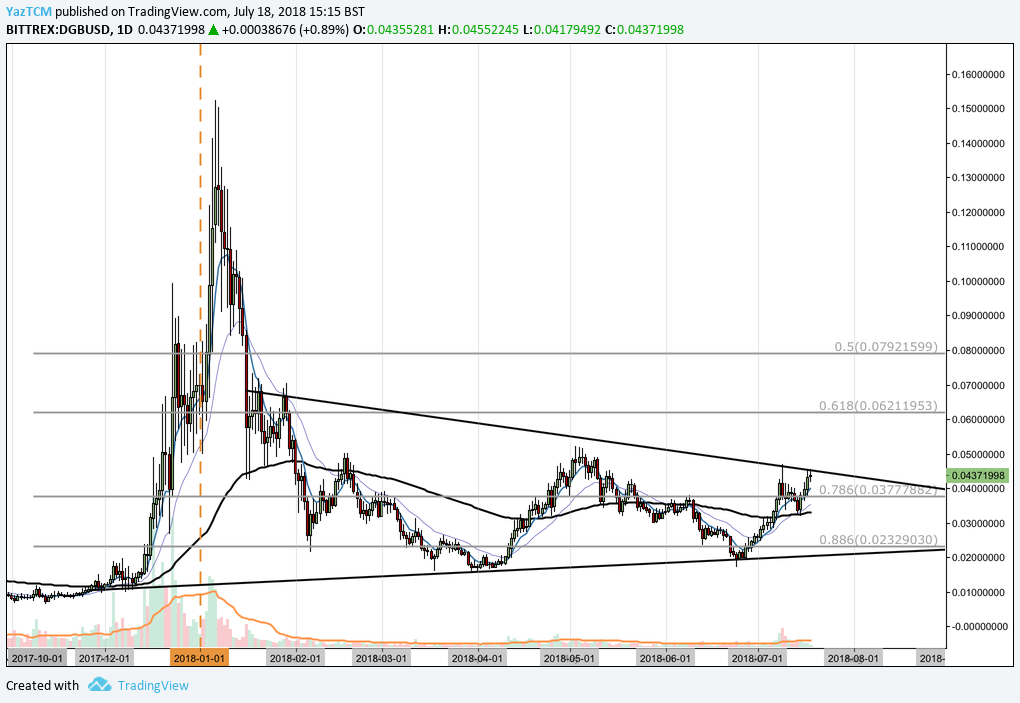
https://www.tradingview.com/x/Hko4WfvR/
Analyzing the market from the long-term perspective above, we can see that DigiByte had experienced a significant bullish run when price action rose from a low of $0.0081 on November 11, 2017 and extended to an all-time high of $0.1412 on January 5, 2018. This was an extraordinary price increase of 1,900% from low to high.
The market went on to tank after placing this all-time high, eventually finding support just below the .886 Fibonacci Retracement priced at $0.02329 during March-April 2018. This is a Fibonacci Retracement taken from the entire bullish run described above.
The recent bullish momentum has pushed the market above the .786 Fibonacci Retracement priced at $0.0377 where it hit resistance at the upper boundary of a symmetrical triangle. We can note that the market has largely been trading within the confines of this technical symmetrical triangle pattern for a period of 6 months.
Let us continue to analyze market action from the more recent period a little closer to highlight some potential support and resistance zones.
DGB/USD – SHORT TERM – DAILY CHART
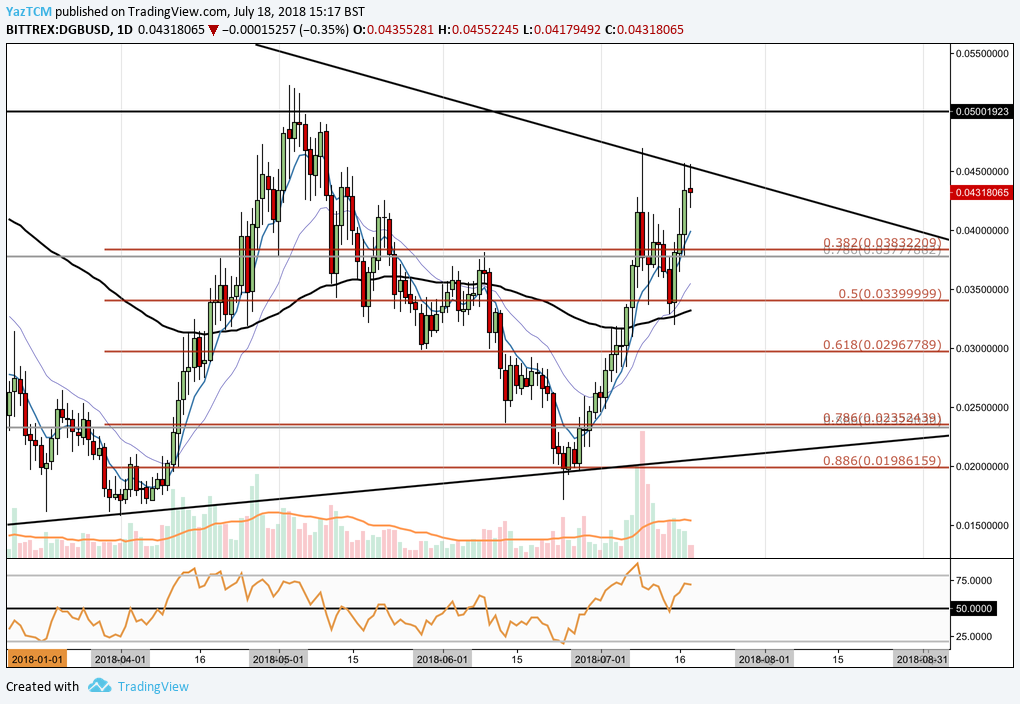
https://www.tradingview.com/x/aZFKaWgX/
Analyzing the market with advantage of a shorter time period, we can see that DGB had experienced another smaller bullish run during April 2018 when price action started from a low of $0.01579 on April 1, 2018 and rose to a high of $0.0522 on May 3, 2018. This was a price hike of 225% from low to high.
We can see that the market fell after placing this high, initially finding support at the short-term .618 Fibonacci Retracement (drawn in red) priced at $0.02967 toward the end of May. This is a Fibonacci Retracement measured from the bullish run described in the paragraph above.
Price action fell through the .618 Fibonacci Retracement during June 2018 where it dropped until it found support at the short term .886 Fibonacci Retracement (drawn in red) priced at $0.01986. We can notice that this area of support was significantly bolstered by the lower boundary of the symmetrical triangle. This extreme level of support caused the market to rebound and begin the aggressive rally that followed.
This aggressive rally has pushed the market to where it is currently trading at resistance created from the upper boundary of the symmetrical triangle. We can see that price action is struggling to maintain itself as each time it attempts to break above the triangle the market is rejected. Price action will require a significant level of momentum to be able to break above the upper boundary of this triangle.
If the resistance created by the upper boundary of the triangle proves to be overpowering for the bulls, near-term support can be located at the short-term .382 Fibonacci Retracement priced at $0.03832. This area of support is increased due to the long-term .786 Fibonacci Retracement (drawn in grey) also being located within the area. Support below this area comes in at the .50 Fibonacci Retracement level priced at $0.03399. This area of support is also receives further reinforcement from the 100-day moving average hovering slightly below the level.
Alternatively, if the bullish momentum can push the market above the upper boundary of the symmetrical triangle, near-term resistance can be expected at the $0.050 psychological round number handle. This area of resistance also correlates to the highs witnessed during early May 2018. Further resistance beyond this area can be expected at the long-term .618 Fibonacci Retracement priced at $0.06211.
The technical indicators within the market are leaning toward the favor of the bulls. The RSI indicator is trading well above the 50 handle indicating that bullish momentum is dominating the market. If the RSI maintains a level above the 50 handle, we can expect the bullish momentum to continue.
Similarly, the moving averages are aligned towards favoring the bulls. The 7-day EMA sits above the 21-day EMA which sits above the 100-day EMA, indicating that all moving averages are trending within a strong bullish manner.
Conclusion
Over the past 30 trading days, the 64.59% increase in price for DGB puts it amongst the strongest performing coins over the past month.
The market is currently trading at an important technical level, in the form of a symmetrical triangle, which will require some significant momentum to break above. We will be closely following the development of this technical pattern over the next few days as a break above could indicate a serious continuation of the bullish trend recently formed.
Related: VeChain Price Analysis: VEN Experiences Price Rebound Ahead of Token Migration