
- DigiByte has recently rebounded from December 2017’s price low around $0.0098.
- Price action is currently struggling to break above resistance located at $0.015.
- Support moving forward: $0.014, $0.013, $0.012, $0.0109, $0.009848, $0.008, $0.006, $0.004944.
- Resistance moving forward: $0.015, $0.01664, $0.01831, $0.02070, $0.0220, $0.02329, $0.028.
DigiByte has seen a 7.05% price increase over the past 24 hours after an adverse month of trading during November 2018. The cryptocurrency is now trading hands at a price of $0.0141, at the time of writing, after suffering a price decline totaling up to 37% over the past 30 trading days.
The DGB cryptocurrency is now ranked in 36th position in terms of overall market cap. It presently holds a total market cap value of $157 million after the 53-month old project has seen a 50% price drop over the previous 90 trading days.
Let us continue to analyze DGB over the long term to get an update on the market dynamics.
DigiByte Price Analysis
DGB/USD – LONG TERM – DAILY CHART
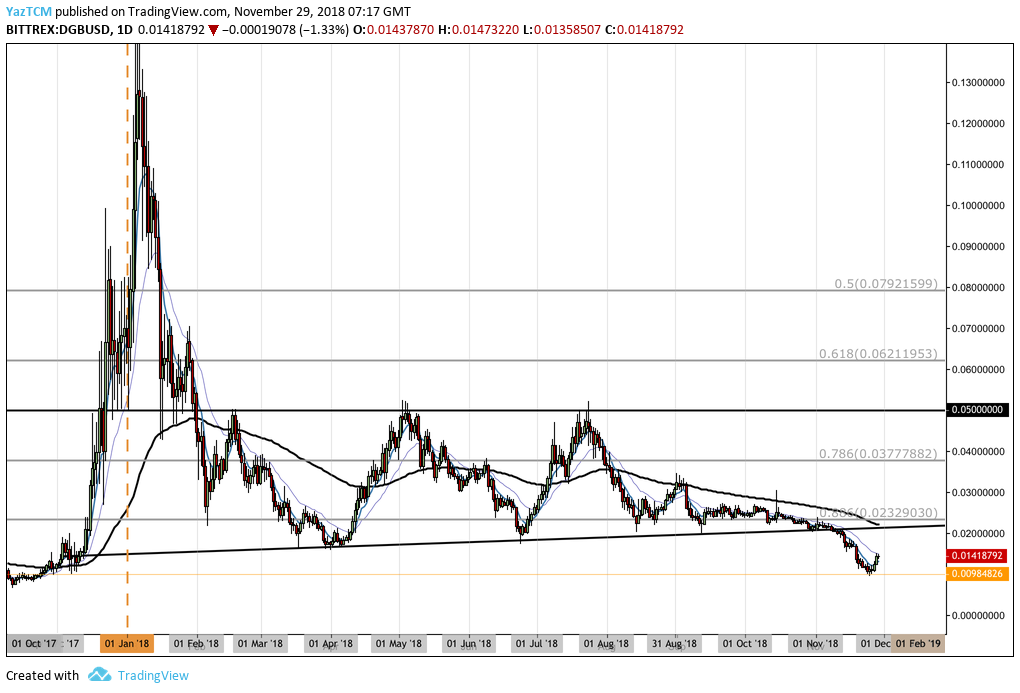
From the long-term perspective above, we can see that DigiByte was largely trading above a shallow rising trend line for the majority of the trading year.
However, this all changed during the November 2018 cryptocurrency market collapse which caused DGB to fall below this rising trend line.
DGB/USD continued to drop throughout November 2018 as it continued to create fresh yearly lows. The market has recently found support at the December 2017 low price around the $0.009848 area. The market was not able to penetrate below this price level and consequently rebounded.
Let us continue to analyze price action a little closer over the short term and highlight any potential areas of support and resistance moving forward.
DGB/USD – SHORT TERM – DAILY CHART
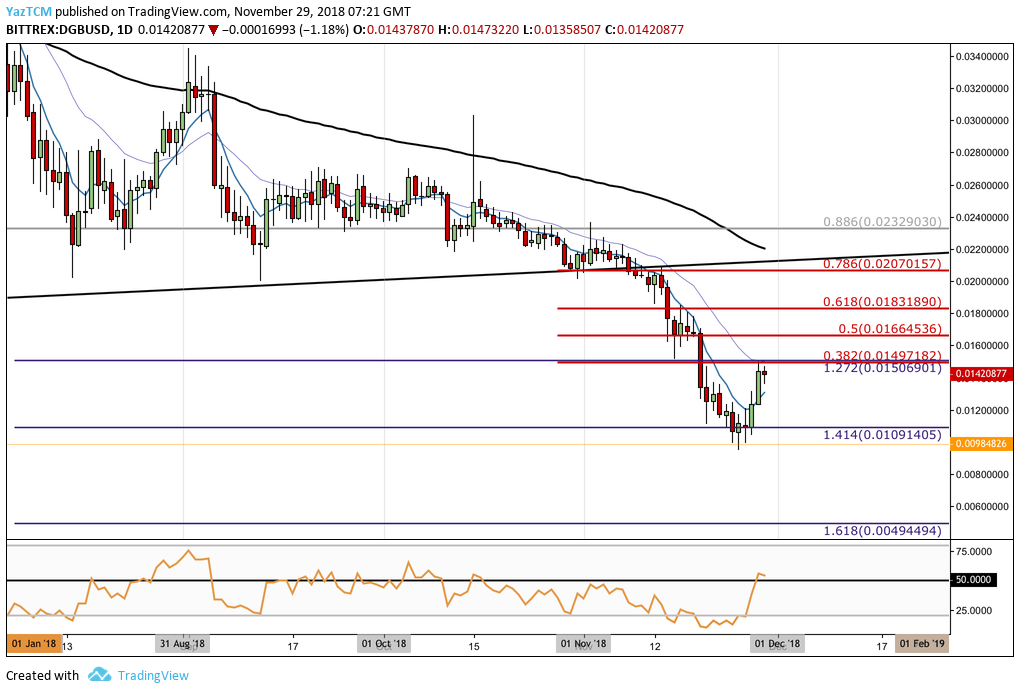
Evaluating the market from a closer perspective, we can see that DGB/USD had found support at a downside 1.414 Fibonacci Extension level (drawn in purple) priced at $0.010914. This support level combined with the December 2017 price low prevented DGB/USD from dropping further.
The market has recently rebounded from this area of support but has recently met resistance at the previous downside 1.272 Fibonacci Extension level (drawn in purple) priced at $0.01506. This area of resistance was also enhanced by a bearish .382 Fibonacci Retracement level (drawn in red) priced within the same region.
This bearish Fibonacci Retracement is measured from the high to the low in November 2018.
Moving forward, if the buyers can continue to drive DGB/USD back above the $0.01506 handle, we can expect further higher resistance to be located at the short-term bearish .5 and .618 Fibonacci Retracement levels (drawn in red), priced at $0.016645 and $0.0183189 respectively.
Resistance above this can then be expected at the bearish .786 Fibonacci Retracement level (drawn in red) priced at $0.02070, followed by the previously broken rising trend line.
If the bulls can persist to push the market back above the previous rising trend line, resistance above can be located at the long-term .886 Fibonacci Retracement level (drawn in grey) priced at $0.02329.
Alternatively, in our bearish outline, if the buyers fail to break above the resistance at $0.015 and the market reverses once again, we can expect immediate support below to be located at the psychological round number support levels at $0.014 and $0.013.
Further support below this can be located at the previous downside 1.414 Fibonacci Extension level (drawn in purple) priced at $0.01091, followed by the December 2017 low priced at 0.009848.
If the sellers then persist to penetrate below the December 2017 low, more significant support below can be located at the downside 1.618 Fibonacci Extension level (drawn in purple) priced at $0.004944.
The RSI has recently risen from oversold conditions to straight back above the 50 handle. This indicates that the previous bearish momentum within the market has disappeared as the bulls begin to gain control of the momentum.
As long as the RSI remains above the 50 level, we can expect DGB/USD to continue to travel higher.
Let us continue to analyze price action for DGB relative to BTC over the long term.
DGB/BTC – LONG TERM – DAILY CHART
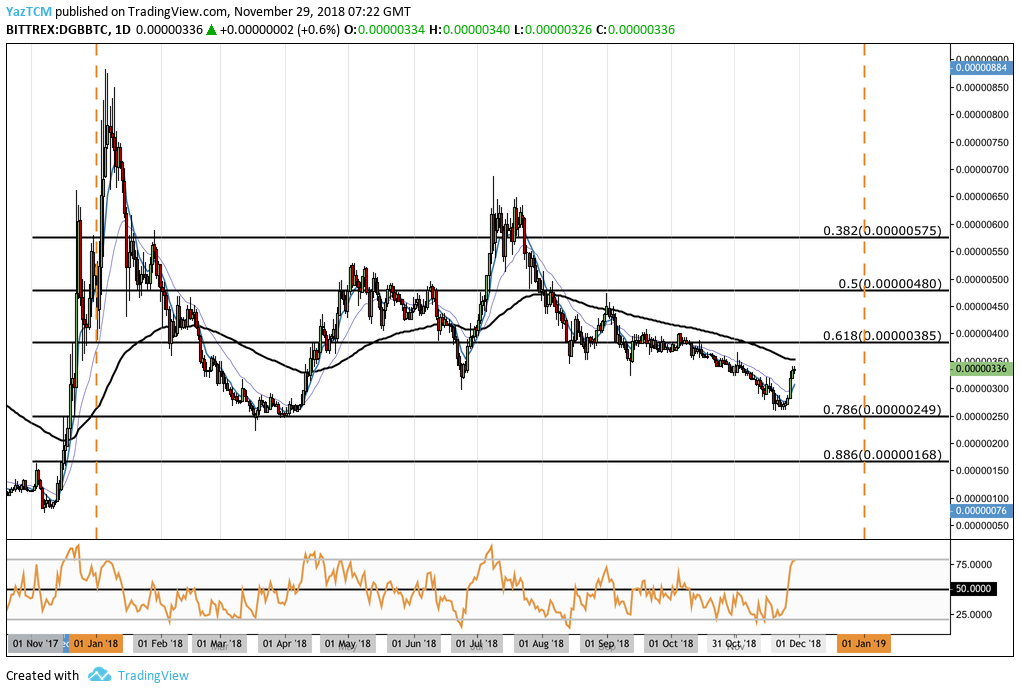
From the long-term overview above, we can see that the market had experienced a significant surge toward the end of 2017 when the market began at a low of 72 SATS on December 8, 2017 and extended to an all-time high priced at 883 SATS on January 6, 2018.
This was a price hike totaling over 1,000% from low to high.
After placing the high, the market went on to drop until it found support at the .786 Fibonacci Retracement level priced at 249 SATS during March 2018. Price action has managed to remain above this support level for the rest of the trading year, and is still yet to break below.
Let us continue to take a closer look at DGB/BTC over the past few months and highlight any areas of support and resistance moving forward.
DGB/BTC – SHORT TERM – DAILY CHART
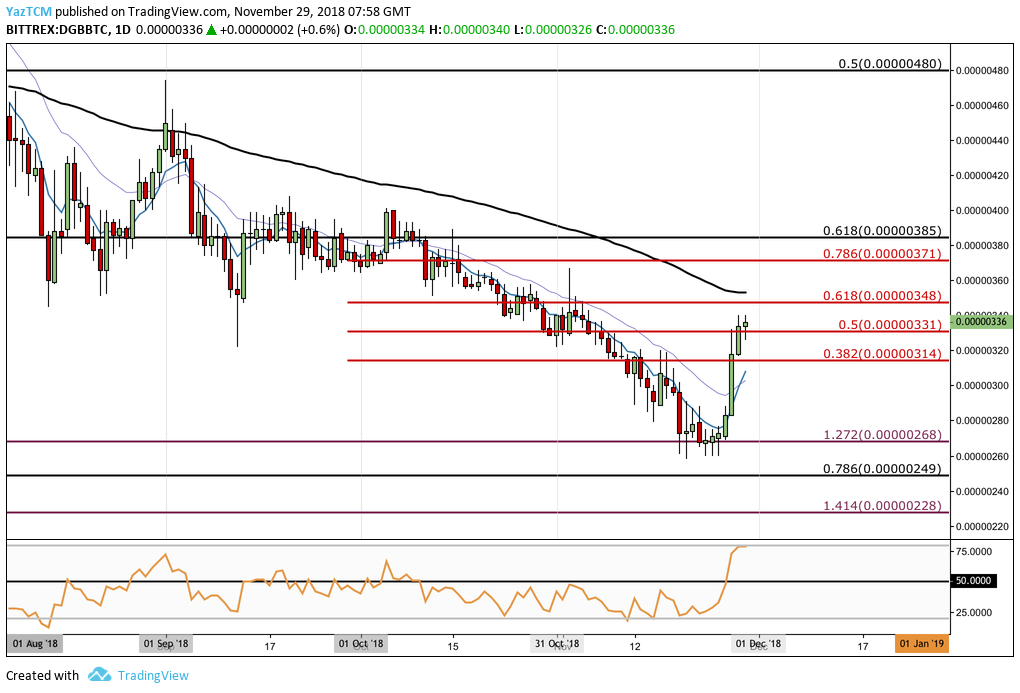
Analyzing DGB/BTC from a closer perspective, we can see that the market has been consistently been declining since the beginning of October 2018. The decline had increased in velocity during November 2018 but the market had recently arrived at support provided by a downside 1.272 Fibonacci Extension level (drawn in purple) priced at 268 SATS.
DGB/BTC has recently rebounded from this area of support and is now trading above support provided by a bearish .5 Fibonacci Retracement level (drawn in red) priced at 331 SATS.
Looking ahead, if the buyers can continue to drive the market higher, we can expect immediate resistance above to be located at the bearish .618 Fibonacci Retracement level (drawn in red) priced at 348 SATS, followed by the 100-day moving average which is currently hovering around the 360 SATS level.
If the bulls can progress further above the 100-day moving average, then we can expect further higher resistance above to be located at the long-term .618 Fibonacci Retracement level (drawn in black) priced at 385 SATS.
On the other hand, if the sellers regroup their efforts and push DGB/BTC back below the support at 331 SATS, we can expect immediate support below to be located at the short-term bearish .382 Fibonacci Retracement level (drawn in red) priced at 314 SATS.
More support below this can be located at the previous downside 1.272 Fibonacci Extension level (drawn in purple) priced at 268 SATS.
If the bears continue to drive price action even further below 268 SATS, further support can be located at the long-term .786 Fibonacci Retracement level (drawn in black) priced at 249 SATS, followed by the downside 1.414 Fibonacci Extension level (drawn in purple) priced at 228 SATS.
The RSI within this market is trading at overbought conditions which could indicate that the market may need a short break before being able to travel higher. If the RSI can remain above the 50 handle on its way down, we can still expect DGB/BTC to head higher.