
Dash has experienced a troubling week, dropping a total of 11% over the past 7 trading days. At the time of writing, Dash is trading hands around $216, and has seen a 1.56% price drop over the past 24 hours.
Dash was created by Evan Duffield in January 2014 and was intended to become a solution to the issues surrounding Bitcoin, such as anonymity and transaction speed. Dash was rebranded from Dark Coin in 2015 and has reaped the rewards from this rebrand ever since, making it a more accessible coin for the mainstream to invest in.
Dash, dubbed Digital Cash, can boast a blocktime of 2.5 minutes which is up to 4x faster than Bitcoin’s 10 minute block mining time. Users can also send Dash almost instantly through a feature known as InstantSend embedded into the Dash wallet. The Dash network can also boast about the benefits gained from allowing users to send private transactions, invisible on the blockchain, through a feature known as PrivateSend.
Dash has recently released an updated version of their code as they push V12.3 to the blockchain recently. V12.3 is meant to allow for faster transaction speeds and improvements to the Dash network all round.
Another thing that sets Dash apart from other coins is the use of the Dash Masternodes system. Users can set up Masternodes to help maintain the blockchain and a secondary layer. The Masternodes help facilitate Dash’s PrivateSend and InstantSend functions within the network. However, to set up a Dash node will cost a user 1,000 Dash, which is a total of $21,900 at today’s value. For more information on Dash and their Masternodes system, refer to our guide, “What is Dash.”
Dash is currently ranked 14th in terms of overall market cap across the entire industry with a total market cap value of $1.80 billion. This is $400 million lower than the market cap high seen 30 days ago of $2.20 billion on June 12, 2018.
Let us continue to analyze Dash’s price action over the long term.
Price Analysis
DASH/USD – LONG TERM – DAILY CHART
https://www.tradingview.com/x/5JKt0Ysv/
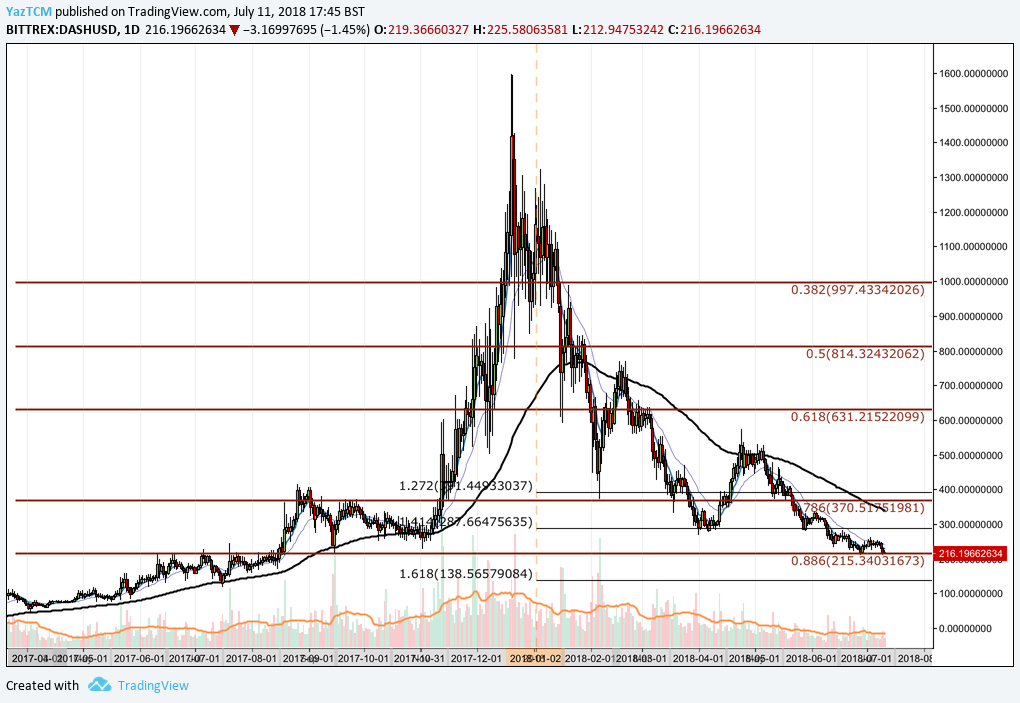
Analyzing the market from the long-term perspective above, we can see that Dash had experienced a major bullish price run during the months of November 2017 and December 2017, similar to the majority of other altcoins within the market at this time period. Price action has since returned to price levels that are now lower than the base price of the bullish run described above.
However, analyzing the chart at a further distance, we can see that Dash’s price run started many months before November 2017 when it rose from a low of $52.53 on April 2, 2017 and extended all the way to $1,596 on December 20, 2017. This entire bullish run caused price to increase by over 3,500% from low to high.
After placing this all-time high at $1,596, price action began to decline during January 2018, initially finding support at the .618 Fibonacci Retracement priced at $631. This is a Fibonacci Retracement of the entire bullish run seen from April 2017 to December 2017.
The market continued to fall throughout the rest of the year, dropping to where it is currently trading, at support, around the .886 Fibonacci Retracement level priced at $215.34. This price level has provided ample support during June 2018 and also August/September 2017.
If the market can find support at this level, the nearest level of resistance from a long term perspective comes in at the .786 Fibonacci Retracement priced at $370.
Alternatively, if the market continues along the bearish trajectory see throughout the past 2 months and pushes price below the .886 Fibonacci Retracement, then the nearest level of support from a long-term perspective comes in at the 1.618 Fibonacci Extension priced at $138.56.
Let us continue to analyze price action over the more recent period a little closer to highlight any further support or resistance zones.
DASH/USD – SHORT TERM – DAILY CHART
https://www.tradingview.com/x/5poLvpW0/
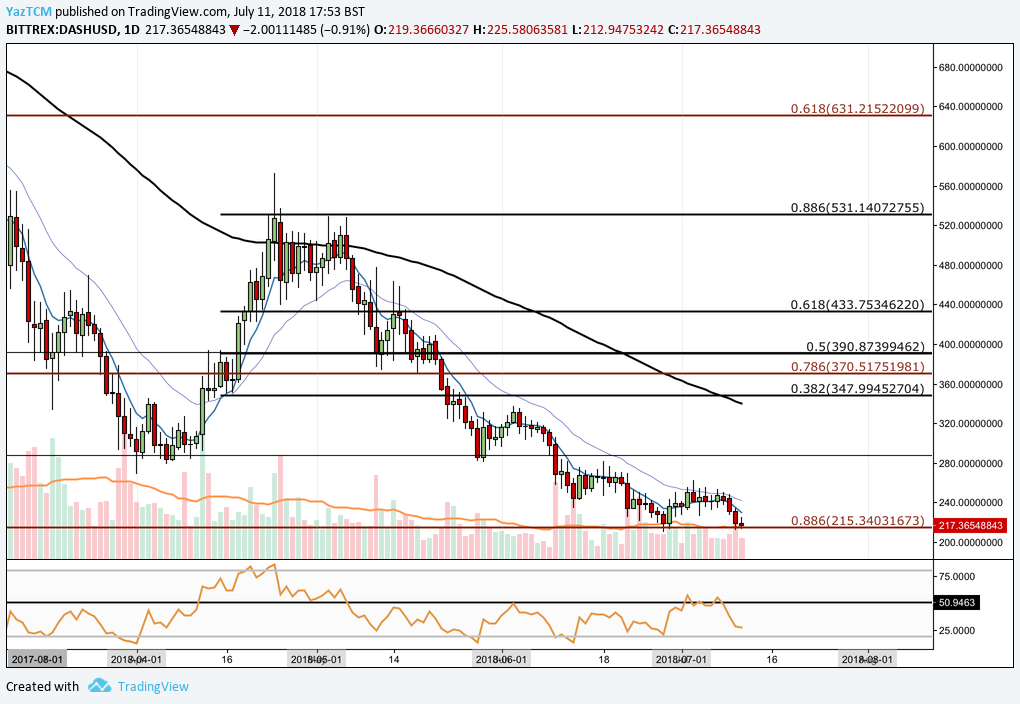
Analyzing the market from a shorter time horizon, we can see that Dash had experienced a small bullish run during April, rising from a low of $268 on April 1, 2018 and extending to a high of $572 experienced on April 24, 2018. This was a price increase of around 112% from low to high.
However, as the market began trading in May, it hit resistance around $531 and began to roll over, falling towards support at April’s low day close price around $282. As June started trading, the market fell lower until it found support at the long term .886 Fibonacci Retracement priced at $215 (marked in red). This is where the market is once again currently trading.
If the market can garner enough bullish momentum at this support level, then we expect near-term resistance to come in at April’s price low around $282. Further short-term resistance is expected at the bearish .382 Fibonacci Retracement, priced at $347. This is a Fibonacci Retracement taken from the bearish leg witnessed over the past 2 months when price action started at a high of $572 on April 24, 2018 and fell to a low of $209 by June 28, 2018.
If the bullish momentum can push the market above the long-term .786 Fibonacci Retracement priced at $370 (marked in red), then further resistance comes in at short-term bearish .886 Fibonacci Retracement priced at $531. This area of resistance is also bolstered by the fact that this is close to the highs witnessed in April.
The technical indicators are currently favoring the bears within the market. The RSI is trading below the 50 handle, heading toward oversold conditions at the 20 handle. The RSI has traded below the 50 handle for a long period of time extending over 3 months. If we want to see the bearish momentum subside within the market, we will need to see the RSI battle toward the 50 handle and eventually break above it.
Similarly, the moving averages are providing favor toward the bears. The 7-day EMA has recently turned away from the 21-day EMA indicating that the bearish pressure is yet to continue within the market. If we want to see bullish momentum increase, we would like to see the 7-day EMA cross above the 21-day EMA.
Conclusion
Dash is currently trading at price levels that had not been seen for 7 months before June. The very low price level provides optimal opportunity for investors to enter the market at rates unimaginable during the early 2018 cryptocurrency boom.
With such a strong development team and community, it is inevitable that Dash will continue to regain some of the losses experienced throughout 2018.
Related: Will Dash Hit its Stride in 2018 Despite Development Delays?