Dash has been trading in a consolidation type of market over the past month or so, and is now in the perfect position for the bulls to start the push for another great bullish run. Dash is currently trading on exchanges at around $180 per token after seeing a small 3% price drop over the past 7 trading days.
Dash is currently ranked 13th according to market cap value across the entire industry. It has a total market cap value of $1.51 billion after the 56-month old coin experienced a 18% price decline over the past 90 trading days. The cryptocurrency is currently trading at a price that is 88% lower than its all-time high (ATH) value.
Dash Price Analysis
DASH/USD – LONG TERM – DAILY CHART
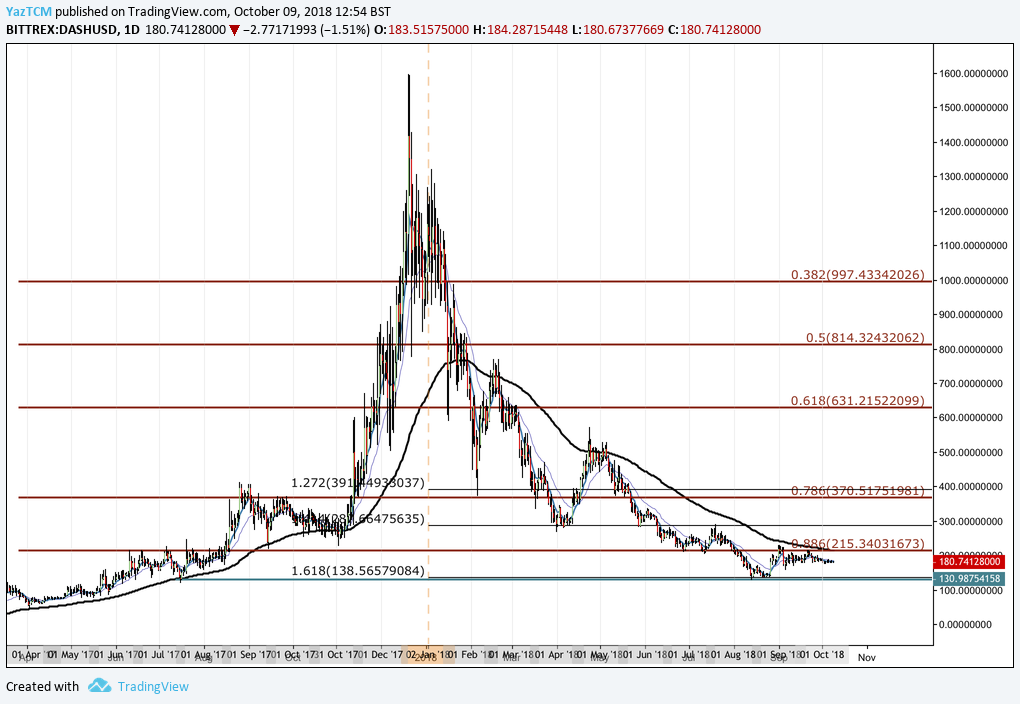
Looking at the DASH/USD market from a long-term outlook, we can see the bullish price run when the market began at a low price of $44.52 on April 3, 2017 and continued to rise to an ATH price of $1596.73 on December 20, 2017. This was a price increase totaling over 3,500% from low to high.
After DASH hit its ATH price, the market reversed and began to decline. It continued to fall throughout the entire trading year, almost completing a 100% Fibonacci Retracement of the bullish run outlined above.
We can see that the market managed to find support at a long-term downside 1.618 Fibonacci Extension level priced at $138.56, during August 2018. The market has since rebounded. It is now now restricted towards the upside until DASH/USD can break above the long-term .886 Fibonacci Retracement level priced at $215.34.
Let us continue to analyze price action a little closer over the short term and highlight any potential support and resistance zones.
DASH/USD – SHORT TERM – DAILY CHART
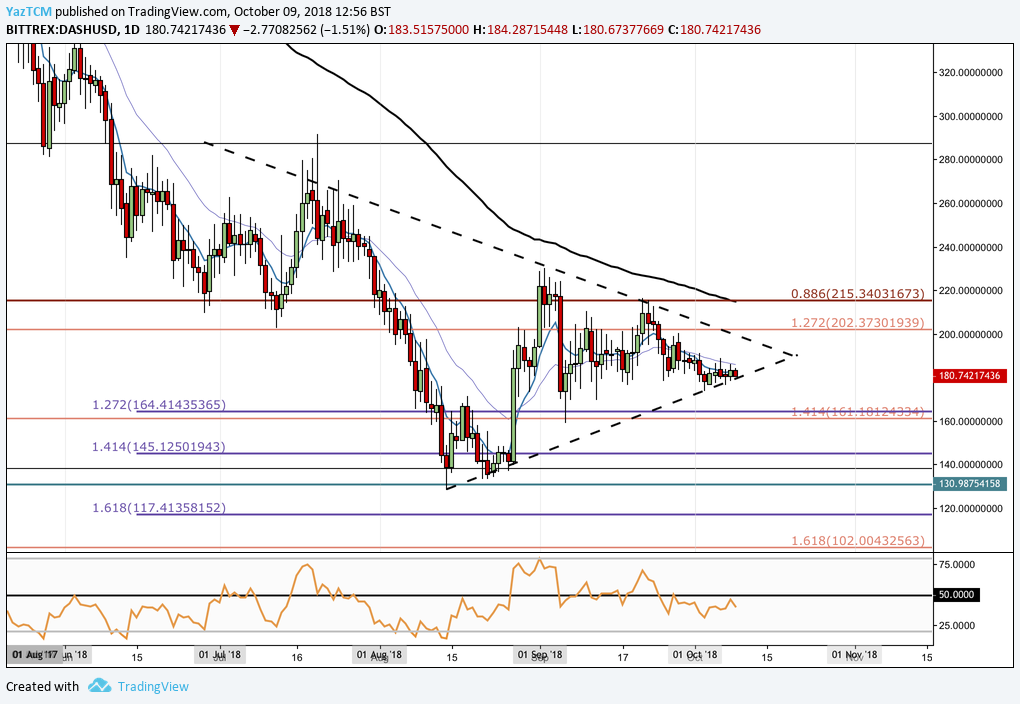
Analyzing the market with the benefit of a closer time frame, we can see that the DASH market had found an array of support during August 2018 which helped keep price action above the $130 handle. The long-term downside 1.618 Fibonacci Extension (previously mentioned) combined with the short-term downside 1.414 Fibonacci Extension level (drawn in purple) priced at $145 helped to prevent DASH/USD from slipping far below $130 during August 2018.
It is also apparent that as the consolidation period has progressed, price action has established a symmetrical triangle formation clearly defined by the falling upper boundary and the rising lower boundary.
Price action is now currently trading at support provided by the lower boundary of the triangle. The market is rapidly approaching the apex where a breakout is expected.
Moving forward, if the bears push price action below the lower boundary of the symmetrical triangle, then immediate support located below can be expected at the short-term downside 1.272 Fibonacci Extension level (drawn in purple) priced at $164.41.
Further support below this can then be expected at the short-term downside 1.414 Fibonacci Extension level (drawn in purple) priced at $145, followed by the long-term downside 1.618 Fibonacci Extension level (drawn in black) priced at $138.56 and the $130 handle.
Alternatively, if the bears can regather momentum at the support provided by the lower boundary and push the market higher, we expect immediate resistance higher to be provided by the upper boundary of the triangle. If the bulls can then push DASH/USD above the triangle, we can expect further resistance higher at the long-term .886 Fibonacci Retracement level priced at $215.34.
The resistance found in this area is further reinforced by the 100-day moving average which is also converging within the same price area.
If the bullish momentum persists even further, resistance higher can then be located at the September 2018 price high at $230, followed by the July 2018 price high at $290. The final level of significant resistance to highlight is the long-term .786 Fibonacci Retracement level priced at $370.51.
The RSI technical indicators within the market is currently slightly favoring the bears. It is trading marginally underneath the 50 handle, indicating that the bears are in control of the momentum within the market. If the RSI can break back above the 50 handle, we can expect the market to continue to make gains.
Let us quickly continue to analyze price action for DASH relative to BTC over the long term and highlight any potential support and resistance levels.
DASH/BTC – LONG TERM – DAILY CHART
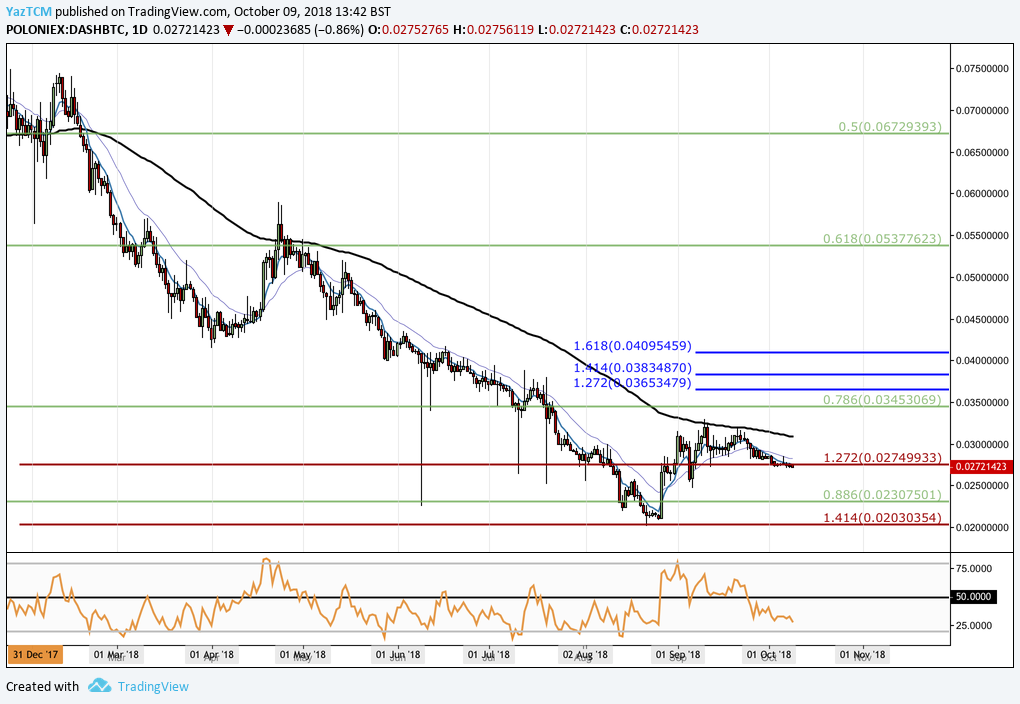
Analyzing the DASH/BTC market above, we can see that price action has been consistently falling over the majority of the trading year. It had recently found significant support at a downside 1.414 Fibonacci Extension level priced at 0.02030354 SATS during August 2018. As the market approached this area, we can see that the bulls were strong enough to cause the DASH/BTC price action to reverse.
The market went on to then rally during September until meeting resistance at the 100-day moving average. It is currently now trading at support provided by the downside 1.272 Fibonacci Extension level priced at 0.02749933 SATS.
Moving forward, if the bears pressure DASH/BTC lower, we can expect immediate significant support below at the .886 Fibonacci Retracement level priced at 0.02307501 SATS, followed by the previous downside 1.414 Fibonacci Extension level priced at 0.02030354 SATS.
Alternatively, if the bulls can regroup and push price action higher, we can expect immediate significant resistance at the 100-day moving average once again, which is currently hovering around the 0.0309 SATS handle.
If the bullish momentum can push the market above the 100-day moving average, further resistance higher can be located at the .786 Fibonacci Retracement level priced at 0.034553 SATS, followed by the upside 1.414 Fibonacci Extension level (drawn in blue) priced at 0.03834 SATS.
The RSI technical indicator is currently producing a reading that heavily favors the bears as it trades well underneath the 50 handle. For a sign that the bearish momentum is showing signs of failure, we will be closely watching the RSI to head back toward the 50 handle.
Related: Dash Expands Reach By Joining Cryptocurrency ATM Platform CoinFlip