
- DASH/USD breaks below previously highlighted symmetrical triangle.
- The market is still trading below the long-term descending trend line as the buyers currently attempt to break above.
- Support levels moving forward: $160, $150.31, $145.12, $140.15, $130, $128.36.
- Resistance levels moving forward: $167.39, $179.38, $191.38, $200, $206.22, $215.34, $230.29, $257.45, $271.25, $291.08.
Dash has seen a small retrace totaling 2.12% over the past 24 hours of trading. The cryptocurrency is presently exchanging hands at a price around $163.52, at the time of writing, after suffering a further decline amounting to 3.62% over the last 7 trading day period.
Today, Dash is ranked in 13th position in market cap rankings, with a total market cap value of $1.37 billion. DASH/USD has enjoyed a 90-day trading period where the markets have risen by over 19%. The 57-month old coin is now trading at a price that is 89% lower than its all-time high value.
Let us continue to analyze price action for DASH/USD over the short term and update any relevant areas of support and resistance.
Dash Price Analysis
DASH/USD – SHORT TERM – DAILY CHART
For a long term overview of DASH/USD, we recommend looking over our last DASH/USD analysis as the long-term scenario is still valid.
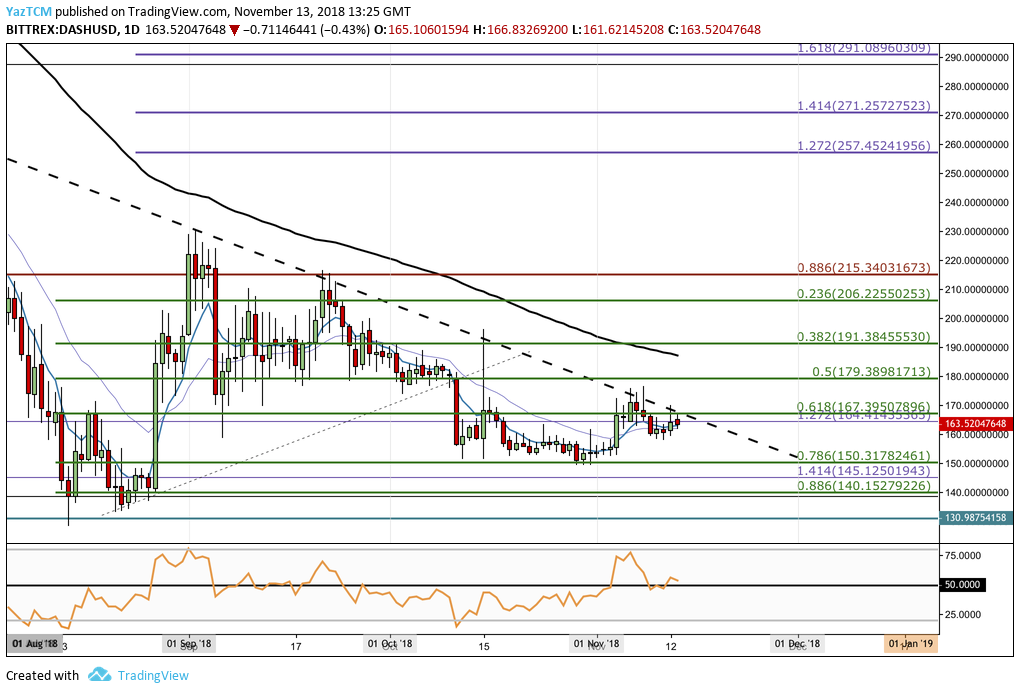
Analyzing the DASH/USD market from the short-term perspective above, we can immediately notice that price action has broken below our previously outlined symmetrical triangle pattern on October 11, 2018.
As the market slipped below the triangle, it fell rapidly until finding support further below at the short-term .786 FIbonacci Retracement level (drawn in green) priced at $150.31. This Fibonacci Retracement is measured from the bullish price surge which began at a low of $128.36 on August 14, 2018 and rose to a high of $230.29 on September 2, 2018. This created a price rise totaling 77.69%.
The support at $150.31 had prevented the market from falling further lower during the entire month of October 2018. As November began trading, price action started to rise until it ran into resistance created by the long-term falling tend line where the price increase stalled.
DASH/USD is currently trading at a combined resistance level provided by the long-term falling trend line and the short-term .618 Fibonacci Retracement level priced at $167.39.
If the bulls can regroup their efforts and break above the long-term falling trend line, we can expect immediate higher resistance above to be located at the .5 and .382 Fibonacci Retracement levels (drawn in green), priced at $179.38 and $191.38 respectively.
Higher resistance above this can then be located at the .236 Fibonacci Retracement level (drawn in green) priced at $206.22, followed by the September 2018 high priced at $230.29.
If the buyers can continue to drive price action above the $230.29 handle, further resistance above can be expected at the 1.272 and 1.414 Fibonacci Extension levels (drawn in purple), priced at $257.45 and $271.25 respectively. The final level of resistance to highlight is located at the 1.618 Fibonacci Extension level (drawn in purple) priced at $291.08.
Alternatively, in our bearish scenario, if the buyers fail to break above the long-term falling trend line and price action rolls over, we can expect immediate support below to be located at the short-term .786 Fibonacci Retracement level (drawn in green) priced at $150.31.
If the sellers continue to pressure DASH/USD below the $150 handle, additional support below can be predicted at the .886 Fibonacci Retracement level (drawn in green) priced at $140.12, followed by the the August 2018 low priced at $128.36.
The RSI has recently returned to the 50 handle which indicates that the previous bullish momentum has faded and the market players are deciding which direction to head toward next. If the RSI can remain above the 50 handle, we could see DASH/USD to continue to attempt to break above the long-term downward sloping trend line.
Let us continue to analyze price action for DASH against Bitcoin over the short term and highlight any potential areas of support and resistance.
DASH/BTC – SHORT TERM – DAILY CHART
For a long term overview of the DASH/BTC market, you can revisit our previous Dash analysis as the long-term scenario is still valid.
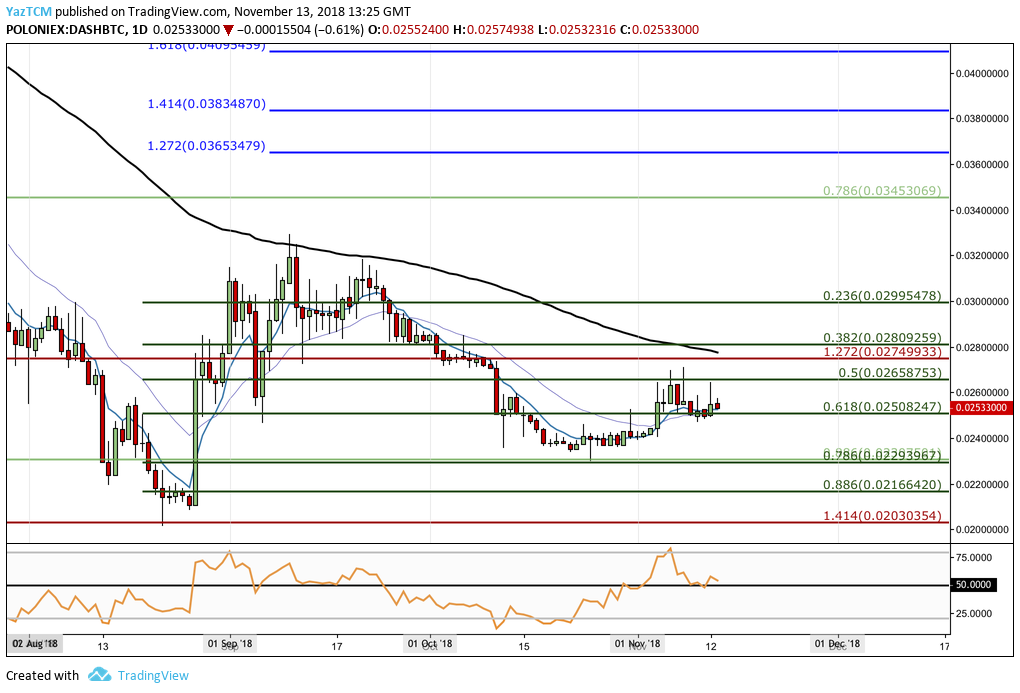
Examining price action from the short-term perspective above, we can see that after the market had reversed its previous downtrend at the downside 1.414 Fibonacci Extension level (drawn in red) priced at 0.020303 SATS, the market went on to rally. There was a price surge totaling 62.72% as DASH/BTC reached a high of 0.03294 SATS on September 10, 2018.
DASH/BTC had reached resistance at the 100-day moving average as it placed this high which caused the market to reverse.
Price action then went on to decline during the rest of September 2018, until reaching further support below at the short-term .786 Fibonacci Retracement level (drawn in green) priced at 0.0229367 SATS during October 2018.
The market went on to rally during the start of November 2018 to where it is currently trading, just above support at the .618 Fibonacci Retracement level (drawn in green) priced at 0.02508247 SATS.
Moving forward, if the buyers persist with their strength to drive the market higher, we can expect immediate resistance above to be located at the .5 and .382 Fibonacci Retracement levels (drawn in green), priced at 0.026587 SATS and 0.028092 SATS respectively.
If the bullish pressure can push DASH/BTC above the September high priced at 0.0329434 SATS, then higher resistance above can be located at the 1.272 and 1.414 Fibonacci Extension levels (drawn in blue), priced at 0.0365347 SATS and 0.0383487 SATS respectively.
On the other hand, if the sellers drive price action below the support at 0.0250827 SATS, we can expect immediate support below to be located at the .786 and .886 Fibonacci Retracement levels (drawn in green), priced at 0.0229367 SATS and 0.02166420 SATS respectively. Further support below this can be expected at the long-term downside 1.414 Fibonacci Extension level (drawn in red), priced at 0.0203035 SATS.
The RSI within this market has managed to remain above the 50 handle. This indicates that the buyers are in control of the market momentum at this current moment in time.