ChainLink has experienced a 2.39% increase in price over the past 24 hours of trading. LINK is currently exchanging hands at a price of $0.2828, and has continued to trade against overall market sentiment. The project has increased by 14.65% over the past 7 trading days, while the majority of other cryptocurrencies have fallen.
ChainLink was founded in 2017 by Sergey Nazarov and launched in June 2017 by a San Francisco company called SmartContract. ChainLink has been described as a decentralized oracle service that bridges the gap between on-chain and off-chain data.
The ChainLink network will allow smart contracts to leverage the ChainLink oracle service in order to communicate with off-chain systems that provide data streams. This data provided to the oracle can then be integrated on-chain through smart contracts.
Currently, blockchains are unable to access data external to that specific blockchains network, limiting their use cases relating to things outside of their network. The ChainLink oracle will allow specific blockchains to integrate reliable real-time data services into their blockchain.
Oracles are described as “agents” that find and verify real-world news & data from off-chain sources. This verified data feed can then be brought on-chain and integrated through smart contracts. The problem comes with verifying if the data sources are correct and up-to-date.
The ChainLink Oracle plans to solve this by decentralizing the entire Oracle process. The ChainLink Network allows owners of data feeds can sell their API data directly to smart contracts in exchange for Link Tokens.
ChainLink is currently 70th in terms of overall market cap across the entire industry, with a total market cap value of $98 million. The 11-month old coin has experienced a price hike totaling 48% over the past 30 trading days, which makes it one of the strongest performing coins of the month.
Let us continue to analyze price action over the long term for ChainLink.
Price Analysis
LINK/USD – LONG TERM – DAILY CHART
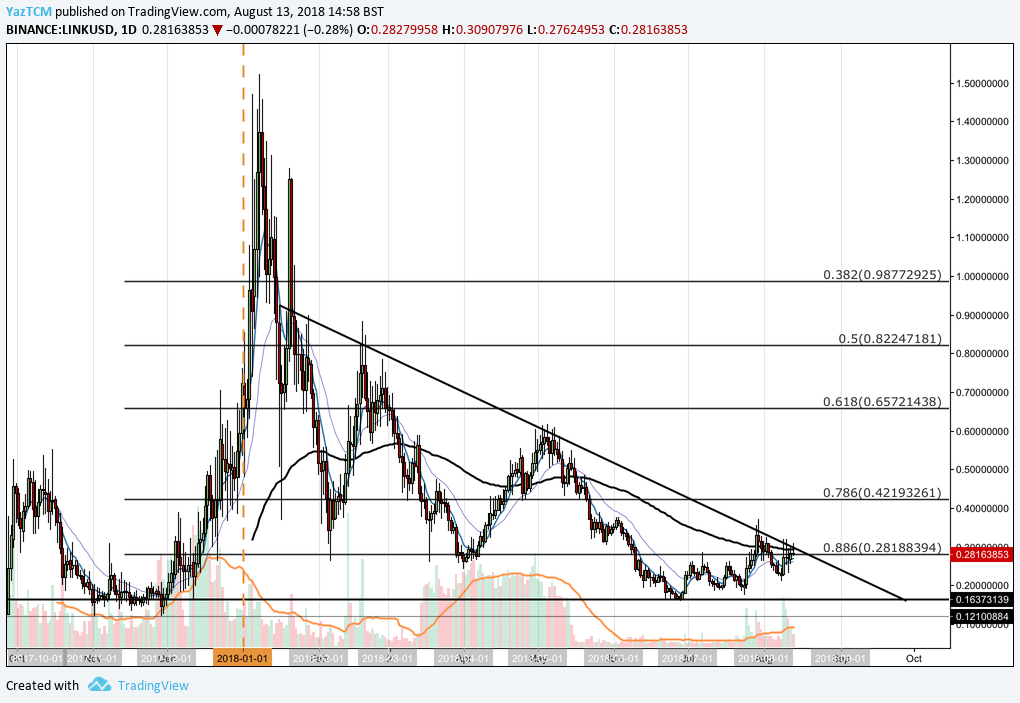
Analyzing the market from the long-term perspective above, we can see that ChainLink has experienced a bullish run toward the end of 2017, when price action started from a low of $0.1215 on November 29, 2017 and extended to an all-time high of $1.5218 on January 8, 2018. This was a price increase totaling 1,200% from low to high.
We can see that the market fell rapidly after placing this all-time high, initially finding support at a .618 Fibonacci Retracement priced at $0.6572 during January 2018. This is a Fibonacci Retracement measured from the entire bullish run aforementioned.
Price action continued to decline throughout February until support was found at the .886 Fibonacci Retracement toward the start of the month, priced at $0.2818. We can see that this price level provided significant support through the months of February, March and April 2018. Each time price action approached this level, it was strongly rejected by the market.
We can also see that throughout the course of the trading year, the market has been confined within a descending triangle pattern. The upper boundary of the triangle has provided significant resistance that the market has not yet able to overcome.
We can see that as July started to trade, the market had experienced further capitulation as price action dropped below the .886 Fibonacci Retracement level, and fell until support was found at the base of the descending triangle priced at $0.16.
Let us continue to analyze price action a little closer over the shorter term to highlight any potential support and resistance areas.
LINK/USD – SHORT TERM – DAILY CHART
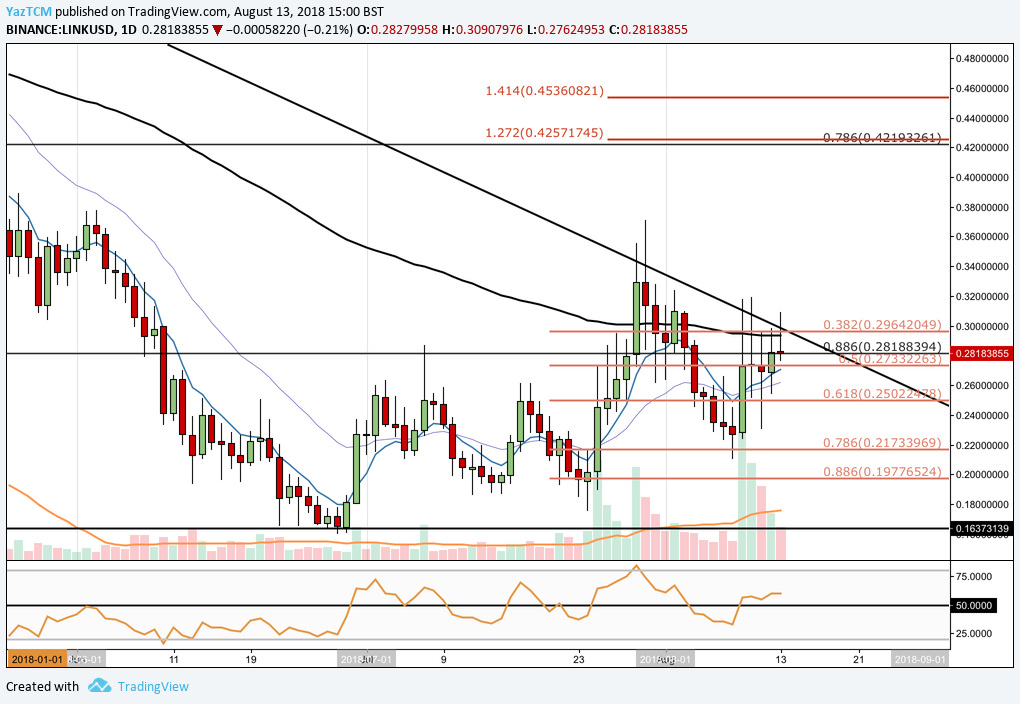
Analyzing the market from the short-term perspective above, we can see that since hitting the yearly low priced at $0.16 during June 2018, the market has reversed and has experienced positive gains. The positive gains started from a low of $0.16 on July 29, 2018 and extended to $0.3710 on July 30, 2018. This was a price increase totaling 130% from low to high.
We can see that when the market placed this intermediary high described above, it had met strong resistance at the upper boundary of the trading triangle and struggled to overcome this level.
Price action is currently trading at resistance marked by the long-term .886 Fibonacci Retracement, once again, priced at $0.28. If the bearish pressure increases and continues to push price action lower, we expect immediate support to be located at the short-term .618 Fibonacci Retracement level priced at $0.25.
Further support below this level is expected at the .786 Fibonacci Retracement priced at $0.21, followed by the .886 Fibonacci Retracement priced at $0.19. In the case of a complete market breakdown, we expect strong resistance to be located at June 2018’s price low at $0.16.
Alternatively, if the bulls can continue their momentum established over the past 30 trading days, we expect immediate resistance to be located at the upper boundary of the triangle, circa the $0.30 handle. If the bullish momentum can persist above the upper boundary of the triangle, we expect further resistance to be located at July 2018’s high priced at $0.37, followed by the long-term .786 Fibonacci Retracement level priced at $0.42.
The technical indicators within the market are starting to show positive favor toward the bulls. The RSI is currently trading slightly above the 50 handle indicating that bullish momentum is still in play. If the RSI continues to rise above the 50 handle, we expect the market to continue ascending.
Similarly, the moving averages have poised themselves in a position that is bullish and has recently signaled a bullish crossover. The 7-day EMA (blue EMA) has recently crossed up above the 21-day EMA (purple EMA) which indicates that the bullish pressure is increasing in the market. If these two moving averages can cross above the 100-day moving average (black SMA), then this would confirm a long-term bullish reversal is in play.