
- LINK/USD has already increased by over 177% since late July 2018.
- LINK/BTC has increased by over 230% since late July 2018.
- LINK/USD now has its sights ready to attempt to break above the $0.50 handle.
- Support moving forward: $0.4257, $0.40, $0.3722, $0.3347, $0.2971, $0.2818, $0.2436, $0.2117, $0.1754.
- Resistance moving forward: $0.4936, $0.50, $0.5338, $0.5772, $0.60, $0.6572, $0.70, $0.80, $0.8224.
ChainLink has seen another 2% price hike over the past 24 hours of trading. ChainLink is presently trading at $0.4511, after experiencing a further 7.87% price increase over the past 7 trading days.
The cryptocurrency is currently ranked 49th in market cap rankings with a total market cap value of around $156 million. ChainLink has seen an extremely positive 90-day trading period where price action surged by over 46%. The 13-month old coin is now trading at a value that is 64% lower than its all-time high price.
Let us continue to analyze price action for LINK/USD over the long term.
ChainLink Price Analysis
LINK/USD – LONG TERM – DAILY CHART
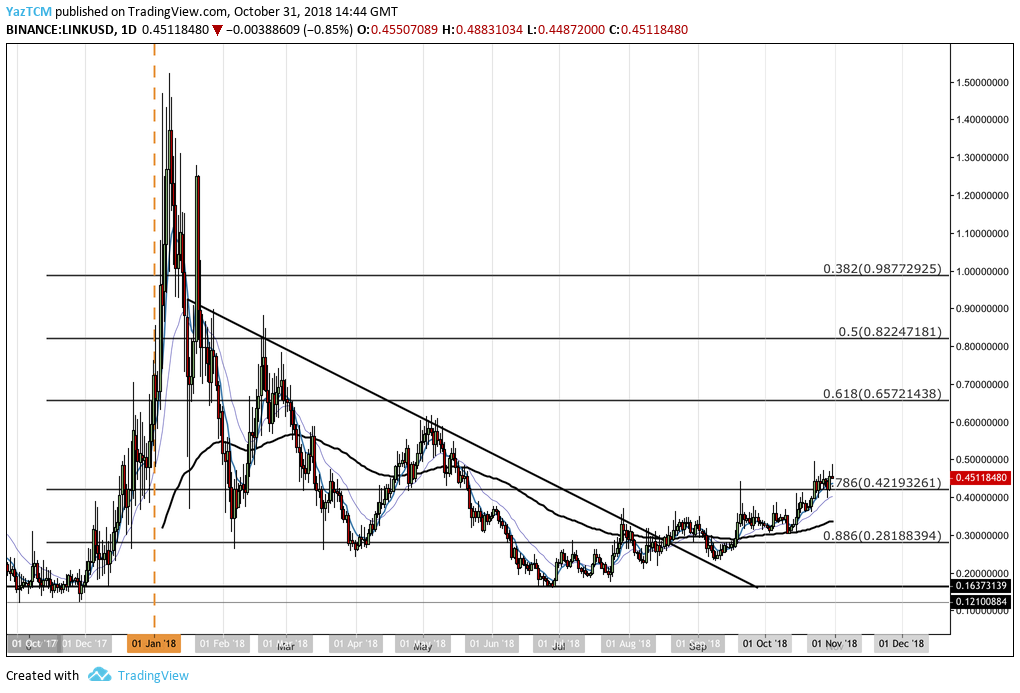
Looking at LINK/USD from the long-term perspective above, we can see that price action had broken out of our previously highlighted triangle pattern during August 2018. After breaking out of the pattern, price action has consistently risen which could indicates that a trend reversal is currently in play.
The market has recently just managed to climb up above the long-term .786 Fibonacci Retracement level priced at $0.4219. The bulls now cast their sights toward penetrating above the psychological round number handle at $0.50.
Let us continue to analyze price action from a closer perspective and highlight any potential support and resistance zones moving forward.
LINK/USD – SHORT TERM – DAILY CHART
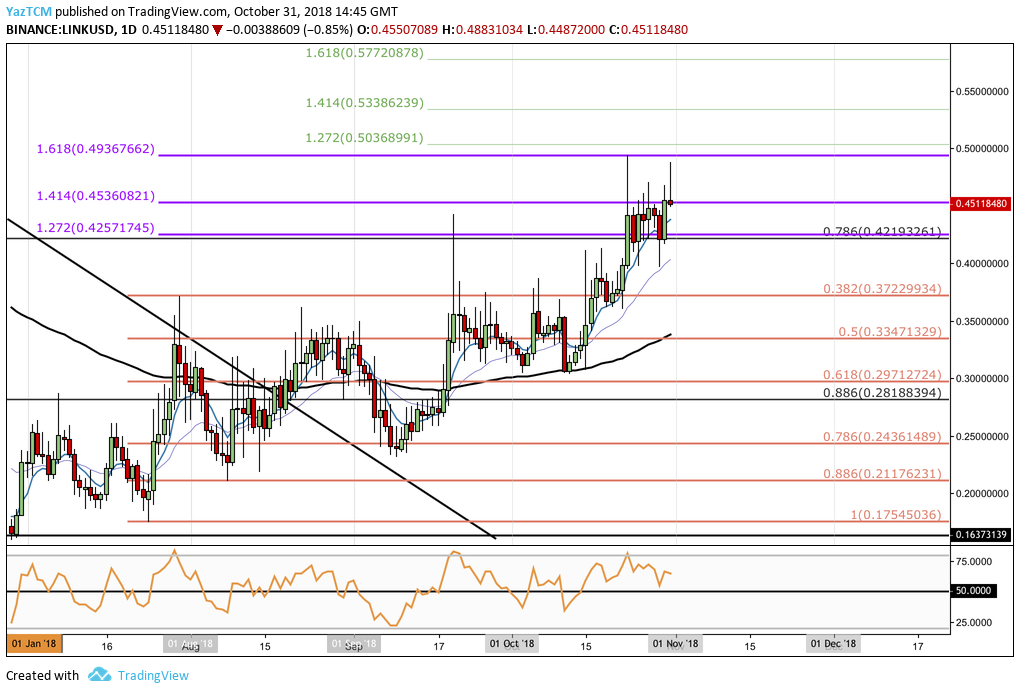
Assessing the market from a closer time horizon, we can see that the LINK/USD market has seen a significant price surge over the past few months. LINK/USD began at a low of $0.1750 on July 24, 2018 and extended to a high of $0.4936 on October 23, 2018. This price increase totaled over 175% from the low to the high.
We can see that as price action had reached the high, it had met resistance at a 1.618 Fibonacci Extension level (drawn in purple) priced at $0.4936. As the market reached this level, the bulls struggled to travel further higher which caused the market to momentarily roll over slightly.
Price action is now trading at support provided by the 1.414 FIbonacci Extension level (drawn in purple) priced at $0.4536.
If the bears continue to pressure the market lower, then they will meet support at the 1.272 Fibonacci Extension level (drawn in purple) priced at $0.4257. This area of support also combines with the long-term .786 Fibonacci Retracement level, strengthening the support base in this area.
If the bears manage to penetrate LINK/USD below the $0.4257 support level, traders can look toward the short-term .382 and .5 Fibonacci Retracement levels (drawn in peach) for further support, priced at $0.3722 and $0.3347 respectively. The 100-day moving average is also trading around the .5 Fibonacci Retracement level, further adding to the level of expected support in this area.
The final 2 areas of support to highlight are the short-term .618 and .886 Fibonacci Retracement levels, priced at $0.2971 and $0.2117 respectively.
On the other hand, in our LINK/USD bullish scenario, if the bulls continue with their 4-month established run of momentum and push price action higher, they will meet immediate resistance above at the 1.618 Fibonacci Retracement level priced at $0.4936.
If the buyers can then continue higher and climb above the $0.50 handle, higher resistance above can be expected at the 1.414 and 1.618 Fibonacci Extension levels (drawn in green), priced at $0.5338 and $0.5772 respectively.
The technical indicators within the market are heavily favoring the buyers at this moment in time. The moving averages are all aligned in the bulls’ favor as the shorter moving averages trade above the longer moving averages.
The RSI indicator is also trading in bullish territory. However, the RSI looks to be declining which may be indicative that the bullish pressure is beginning to fade slightly. So long as the RSI remains above the 50 handle, we can assume that this market will only travel higher.
Let us continue to analyze price action for LINK relative to BTC over the long term.
LINK/BTC – LONG TERM – DAILY CHART

Based on the long-term perspective of LINK/BTC above, we can see the extraordinary late 2017 price surge when the market began at a low of 1,000 SATS on December 12, 2017 and extended to an all-time high of 9850 SATS on January 21, 2018. This total price surge was an increase of over 800%.
The market had then rolled over and continued to decline until the market reversal was seen in July 2018. Price action has since continued to rally higher from this reversal point.
Let us continue to inspect the market a little closer and highlight any areas of potential support and resistance moving forward.
LINK/BTC – SHORT TERM – DAILY CHART
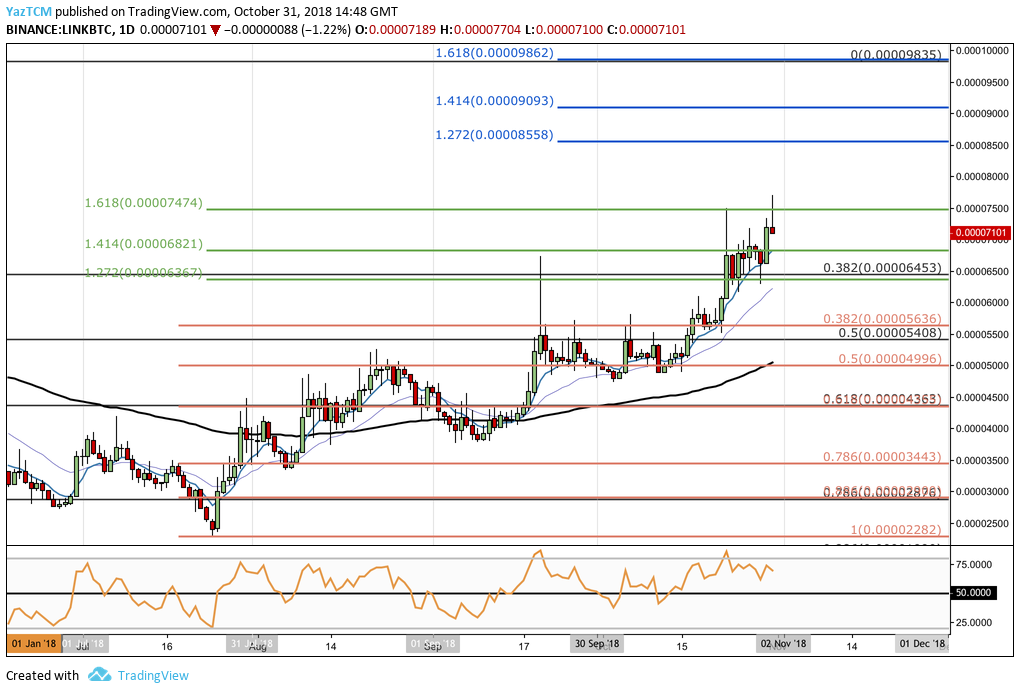 Looking at LINK/BTC above, we can see the bullish run when the market began at a low of 2,276 SATS on July 24, 2018 and continued to rise to a high of 7,704 SATS recently on October 31, 2018. This was a price surge of over 230%.
LINK/BTC is now seeing some resistance as it struggles to break above the 1.618 FIbonacci Extension level (drawn in green) priced at 7,474 SATS. If the market can indeed climb above this level, further higher resistance will be expected at the short-term 1.272 and 1.414 Fibonacci Extension levels (drawn in blue), priced at 8,558 SATS and 9,093 SATS respectively.
If the bulls can continue to climb even higher, then more resistance above will be located at the all-time high price around 9,850 SATS. This level of resistance is also bolstered by the short-term 1.618 Fibonacci Retracement level (drawn in blue) priced in the same region.
Alternatively, if the bears step into the market and pressure price action lower, they will see immediate support below at the 1.272 FIbonacci Extension level (drawn in green) priced at 6,367 SATS. This area also contains the long-term .382 Fibonacci Retracement level (drawn in black) which further adds to the support.
If the momentum drives LINK/BTC even lower, the bulls can look for support at the short-term .382 and .5 Fibonacci Retracement levels (drawn in peach), priced at 5,636 SATS and 4,996 SATS respectively. The 100-day moving average is also hovering around the 4,996 SATS handle, increasing the support expected here.
Even further support below can be expected at the short-term .618 and .786 Fibonacci Retracement levels (drawn in peach), priced at 4,363 SATS and 3,443 SATS respectively.
The RSI indicator is still favoring the bulls in this moment in time as the RSI remains above the 50 handle. This indicates that the bulls are in charge of the momentum within the market.