
Bytecoin has seen a 7.54% price increase over the past 24 hours of trading. The cryptocurrency is currently trading around $0.0021 after seeing a 24% price hike over the past 7 trading days.
Bytecoin is primarily focused on providing a blockchain based on security and privacy that enables users to send transactions that are untraceable to any 3rd party investigator.
The Bytecoin codebase utilises the CryptoNote protocol, the same protocol as Monero, along with the CryptoNight hashing algorithm. Created in 2012, the cryptocurrency uses ring signatures to provide a level of anonymity for the users as all transactions are mixed and therefore untraceable.
For more information on Bytecoin we recommend reading our “What is Bytecoin” guide.
Bytecoin is currently ranked 28th in terms of overall market cap across the entire industry. The 50-month old coin has a total market cap value of $388 million after suffering a 67% price decline over the past 90 trading days.
Let us continue to analyze price action for Bytecoin over the course of the trading year.
Bytecoin Price Analysis
BCN/USD – LONG TERM – DAILY CHART
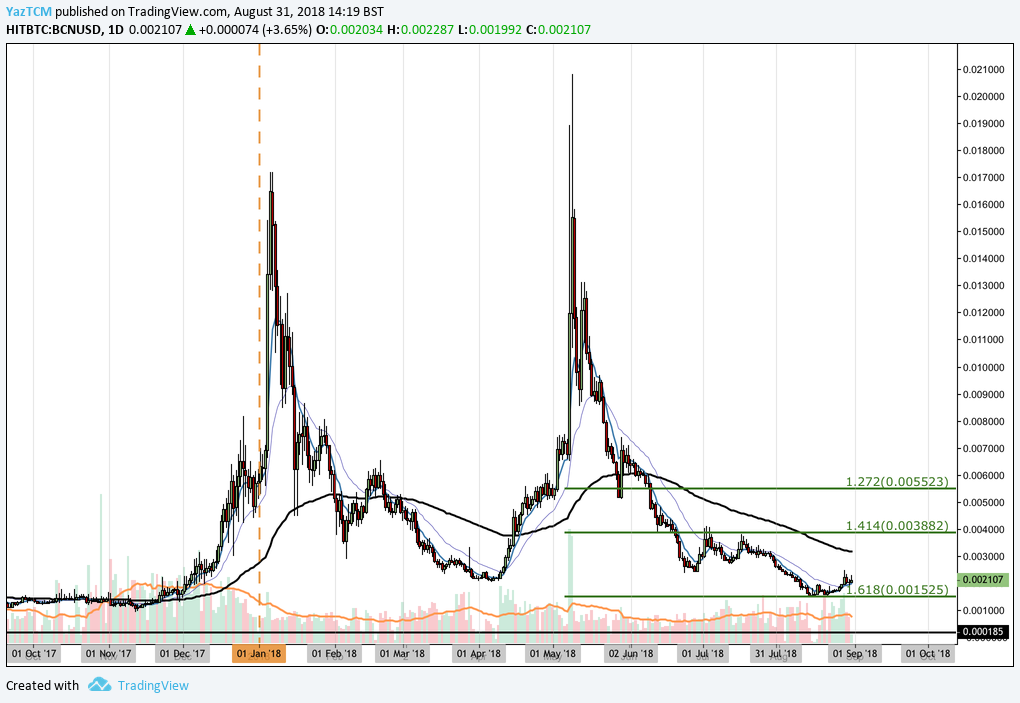
Analyzing the market from the long-term perspective above, we can see that price action had seen 2 significant bullish runs over the course of the past 12 months.
The first bull run began from a low of $0.000927 on November 12, 2017 and extended to a high of $0.017192 on January 7, 2018. This was a price increase totaling 1,600% from low to high. After placing this high, we can see that price action went on to rapidly decline for 3 months until the second bull run started.
The second bullish run started at a low price of $0.002081 on April 7, 2018 and extended to an all-time high of $0.0208 on May 9, 2018. This was another price increase totaling around 975% from low to high.
We can see that after placing this all-time high, price action rolled over once again and began to rapidly decline. It had originally found a brief level of support at the downside 1.272 Fibonacci Extension level priced at $0.005523 toward the end of May 2018, but continued to fall even lower during June and July 2018.
Price action has recently found some form of significant support at the downside 1.618 FIbonacci Extension level. The market has managed to rebound slightly from this support level as it currently trades around the $0.002107 handle.
Let us continue to analyze price action a little closer to highlight any potential support and resistance areas.
BCN/USD – SHORT TERM – DAILY CHART
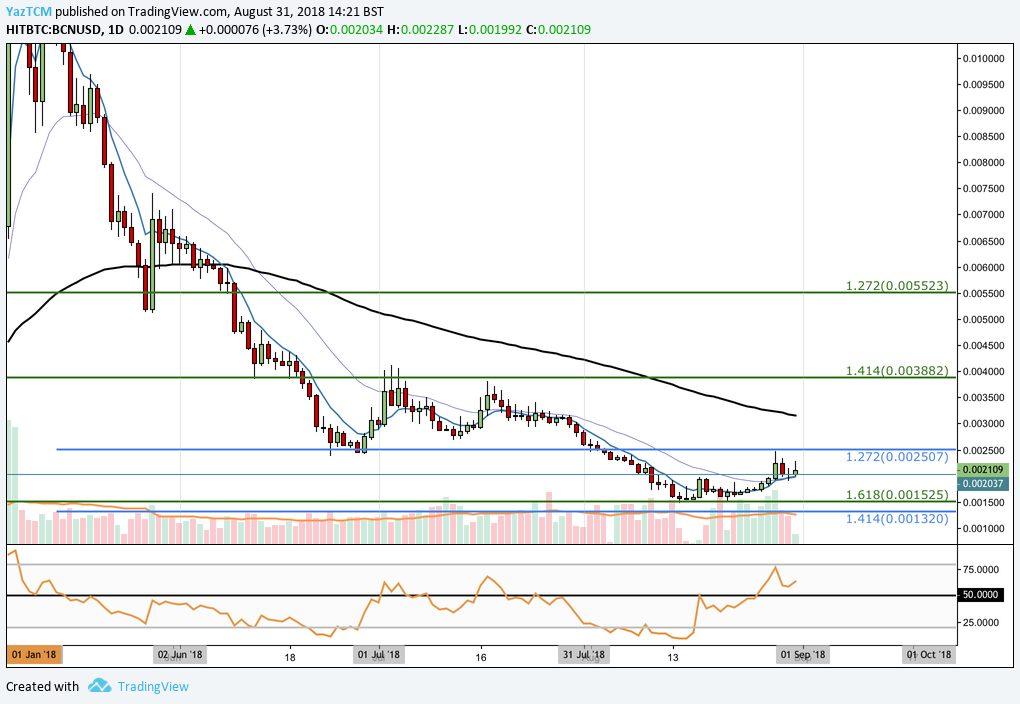
Analyzing the market from the short-term perspective above, we can see that for the majority of August 2018, the market has been trapped within a range bound between the downside 1.618 Fibonacci Extension level (drawn in green) priced at $0.001525 as the lower boundary and the shorter-term downside 1.272 Fibonacci Extension level priced at $0.002507 as the upper boundary.
We can see that price action is currently trading slightly above the April 2018’s price low at $0.02037. If the market continues with the recently established bullish momentum, we expect immediate resistance to be located at the upper boundary of the range priced at $0.002507. This area of resistance is deemed to be significant due to it previously being a strong support level, seen during June 2018 (old support now becomes new resistance).
If the market can continue higher above the upper boundary of the range, we expect further resistance to be located at the 100-day moving average which is currently hovering around the $0.003160 handle, followed by resistance seen by the previous long-term downside 1.414 Fibonacci Extension level (drawn in green) priced at $0.003882.
Alternatively, if the market continues further lower, we expect immediate support to be located at the lower boundary of the range located at $0.001525, given by the long-term downside 1.618 Fibonacci Extension level (drawn in green) priced at $0.001525.
Further support located below can be expected at the short-term downside 1.414 Fibonacci Extension level (drawn in blue) priced at $0.001320, followed by the psychological round number handle of $0.001.
The technical indicators within the market are currently favoring the bulls at this moment in time. The RSI is currently trading above the 50 handle, indicating that the bullish momentum is still in control and that the previous bearish momentum has completely faded. If the RSI can continue to remain above the 50 handle, we can expect this market to continue to appreciate.
Let us continue to quickly analyze price action relative to Bitcoin over the long term.
BCN/BTC – LONG TERM – DAILY CHART
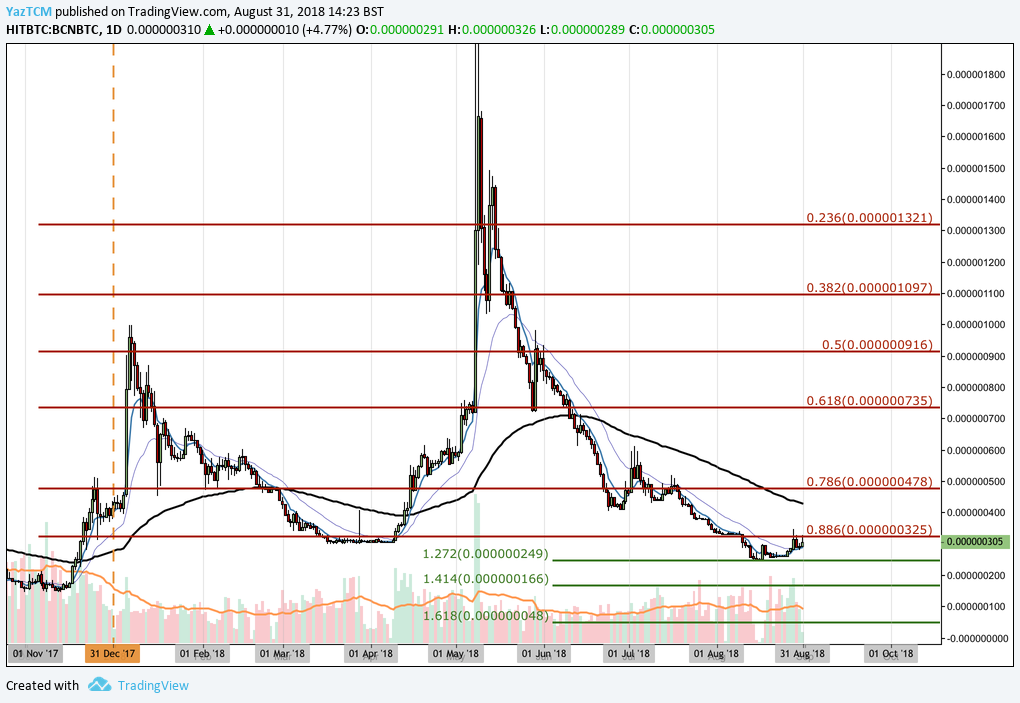
Analyzing price action from the long-term perspective above, we can see that the market had also seen 2 bullish runs over the course of the last 12 months.
The first bullish run started from a low of 147 SATS on December 12, 2017 and extended to a high of 999 SATS on January 6, 2018, a price increase of 619%. The second bullish run started from a low of 304 SATS on April 7, 2018 and extended to an all-time high of 2,220 SATS on May 9, 2018, a price increase of 627%. Over the course of the entire bull run (both combined), price action rose a total of around 1,500% from low to high.
We can see that after placing the all-time high, price action went on to depreciate rapidly. It had originally found support at the .618 Fibonacci Retracement level priced at 735 SATS in May 2018. This FIbonacci Retracement is measured from the entirety of the 2 bullish runs outlined above.
We can see that price action continued to decline through June and July 2018, until the market found some form of stable support at a downside 1.272 Fibonacci Extension level priced at 249 SATS, during April 2018, before rebounding.
The market has been range-bound between 325 SATS as the upper boundary and 249 SATS as the lower boundary. If the bulls can push price action above the 325 SATS handle, we expect immediate resistance to be located at June 2018’s price low at 410 SATS. Resistance above this area will be located at the 100-day moving average which is currently hovering around 436 SATS followed by the .786 Fibonacci Retracement priced at 478 SATS.
Alternatively, any bearish pressure within the market is expected to be absorbed by the lower boundary of the range. If price action does penetrate further below, we expect immediate support to be located at the downside 1.414 Fibonacci Extension level priced at 166 SATS.