
Binance Coin has continued to defy the odds as it carries to appreciate despite the rest of the market falling. The cryptocurrency has gained 1.10% over the past 24 hours of trading with a 4.48% increase over the past 7 trading days. Binance coin is exchanging hands at $13.68, at time of writing.
The Ethereum-based token was created by the team behind the Binance platform. Binance Exchange, founded in 2017, has grown to become one of the biggest cryptocurrency exchanges in the world. The Binance token sale raised $15 million in its ICO as the BNB token allows users to receive discounts for fees involved with trading on their platform. Currently using BNB to purchase cryptocurrencies will result in a 50% reduction in trading fees, which compound over time resulting in extreme savings for traders.
More so, the Binance team have pledged to use 20% of their profits each quarter to buy up BNB tokens to destroy them. This token
burn” results in the supply of the BNB token dropping, thus making the coins more valuable. The team has stated that they will continue to run their BNB buy-back scheme until 50% of the tokens have been removed from circulation, eventually leaving 100 million BNB tokens in total. So far, they have had 4 quarters of token burns, resulting in over 7 million tokens being burnt.
For more information regarding Binance and BNB, you want to read “Binance First Year Review.”
BNB is currently ranked 17th in terms of overall market cap across the entire industry, with a total market cap value of $1.31 billion.
Let us continue to analyze price action for BNB over the long term.
Price Analysis
BNB/USDT – LONG TERM – DAILY CHART
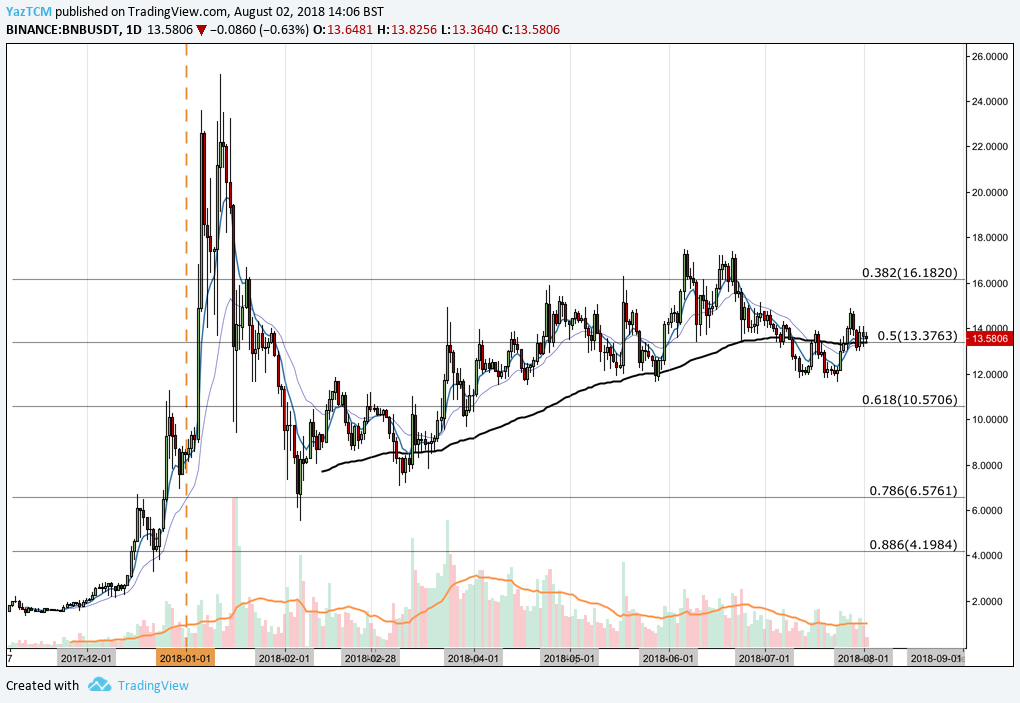
Analyzing the market over the long-term advantage above, we can see that BNB had experienced a major price surge toward the end of 2018 when price action started from a low of $1.34 on November 12, 2017 and appreciated to an all-time high priced at $25.18 on January 12, 2018. This was a price increase of over 1,680% from low to high.
The market went on to depreciate after placing this all-time high, initially finding support at the .5 Fibonacci Retracement priced at $13.37 during January. This is a Fibonacci Retracement measured from the entire bullish run aforementioned.
Price action continued to fall during February until support was found at the .786 Fibonacci Retracement priced at $6.57. This price proved to become the yearly low as the market rebounded from this area.
Let us analyze price action a little closer over the shorter period to highlight any potential support and resistance zones.
BNB/USDT – SHORT TERM – DAILY CHART
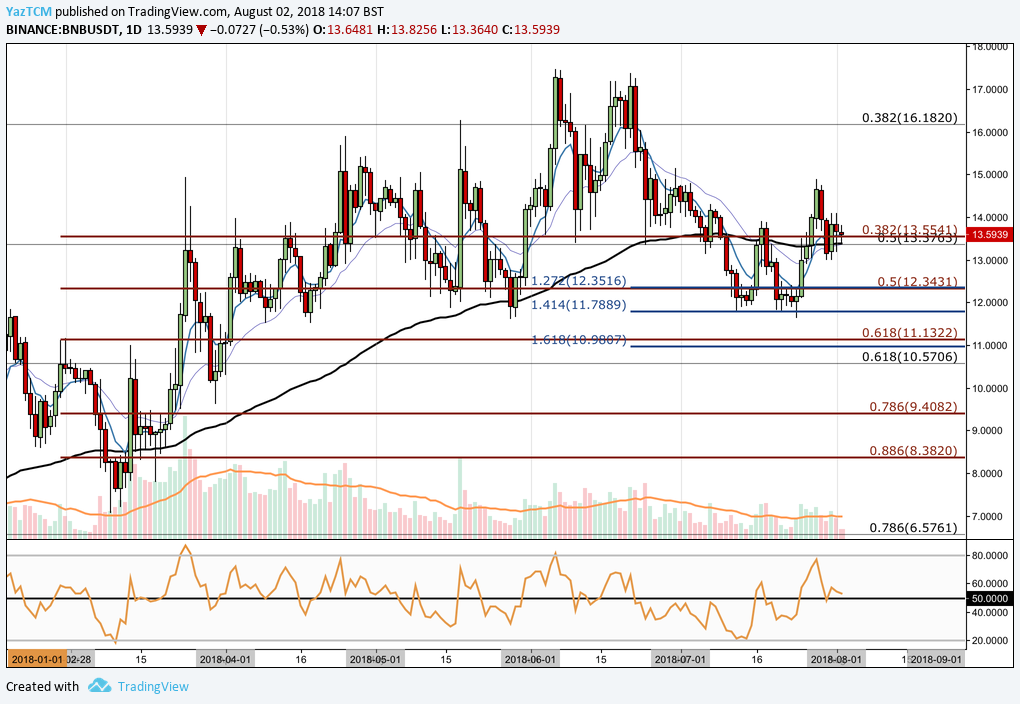
Analyzing the market from a shorter perspective displayed above, we can see that price action had experienced a second bullish run throughout 2018 when the market started at a low of $7.06 on March 9, 2018 and extended to a high of $17.47 on June 6, 2018. This was an increase totaling 145% from low to high.
We can see that as July began trading, price action began to decline, finding support slightly below the short-term .5 Fibonacci Retracement (drawn in red) priced at $12.34. More specifically, price action had found support and reversed at a downside 1.414 Fibonacci Extension level priced at $11.78.
The market is currently trading at support, located at the short-term .382 Fibonacci Retracement priced at $13.55. This area of support is significantly bolstered by the 100-day moving average and the long-term .5 Fibonacci Retracement level, which are both currently hovering marginally below this level.
If the bullish momentum continues, we expect immediate resistance to be located at July’s price high which approached the $15 handle. Resistance above this level is expected at the long-term .382 FIbonacci Retracement level priced at $16.18. If the market can continue further higher beyond the high seen at $17.47, we expect the nearest level of resistance to be located at 1.272 Fibonacci Extension (not drawn on the chart above) priced at $20.28.
Alternatively, if the bearish momentum picks up, immediate support can be located at the short-term .5 Fibonacci Retracement priced at $12.34. Further support located below this can be found at the downside 1.414 Fibonacci Extension priced at $11.78, followed by the 1.618 Fibonacci Extension priced at $10.98.
The RSI technical indicator is currently marginally favoring the bulls within the market as it currently trades above the 50 handle. If the RSI can mange to continue to stay above the 50 handle, we can expect the bullish momentum to continue within the market.
Let us continue to analyze BNB against BTC over the long term.
BNB/BTC – LONG TERM – DAILY CHART
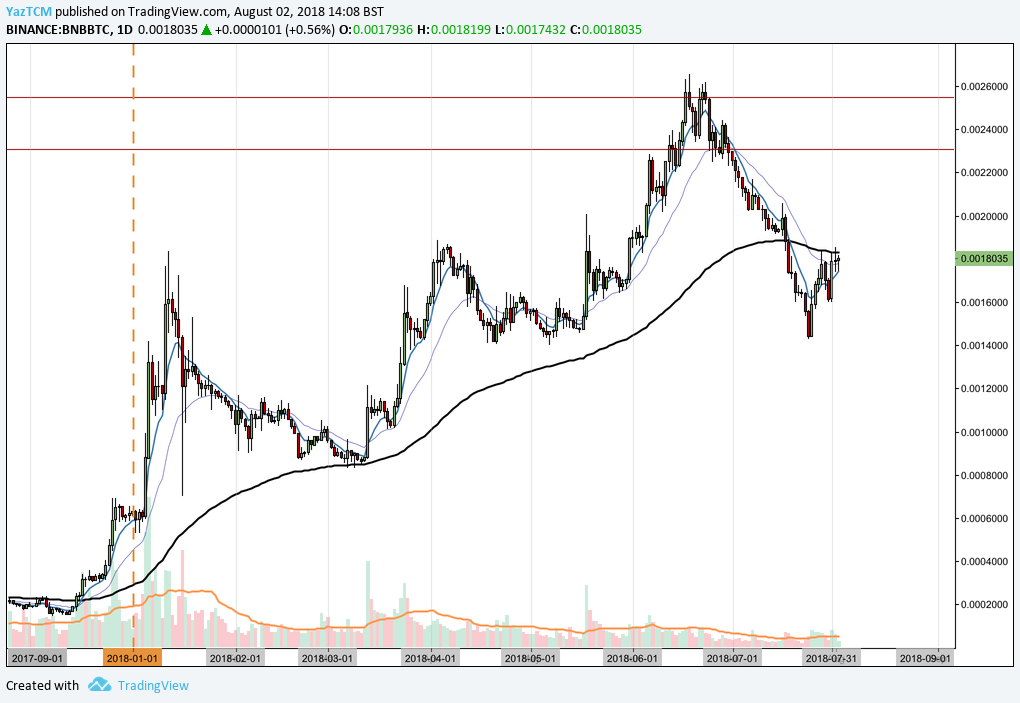
Analyzing the market from the long-term perspective above, we can see that BNB had experienced two significant bullish waves throughout its trading lifetime. The first wave started from a low of 1,519 SATS on December 13, 2017 and extended to a high of 18,382 SATS on January 12, 2018. This was a price increase totaling 1,080% from low to high.
The second bullish wave started from a low of 8,505 SATS on March 11, 2018 and extended to an all-time high of of 26,555 SATS on June 18, 2018. This second wave resulted in a price increase totaling 210%.
We can see that during July, the market had significantly declined and consequently fell below the 100-day moving average.
Let us continue to analyze price action a little closer from the perspective of the second bullish wave.
BNB/BTC – SHORT TERM – DAILY CHART
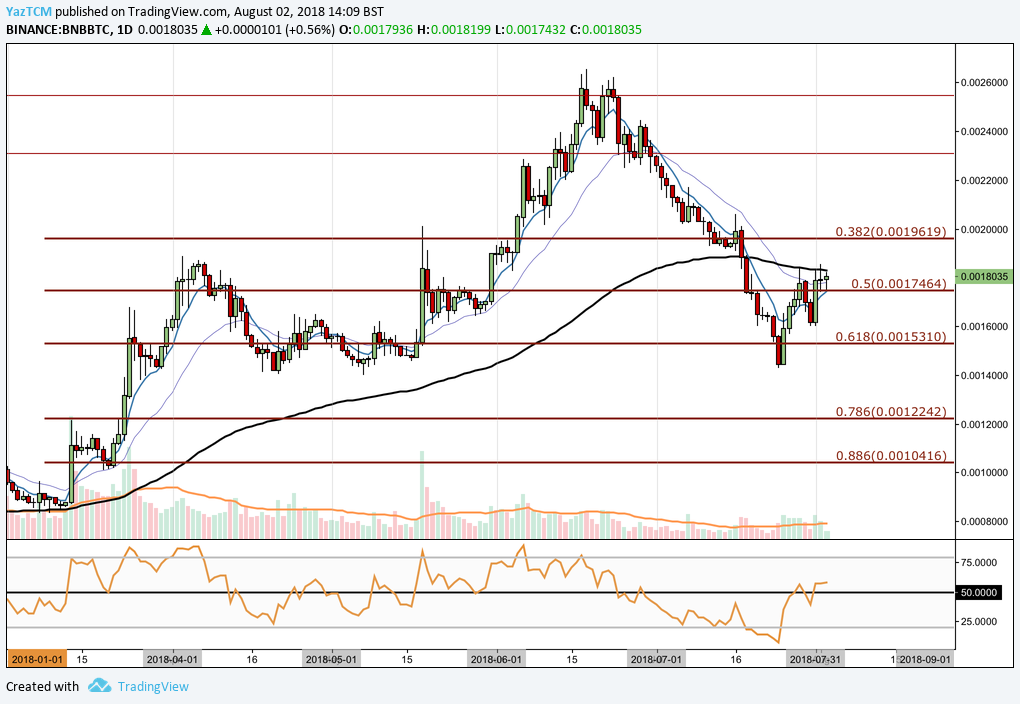
The graph above shows the second bullish wave which totaled 210%, as described in the previous section. We can see that July had caused the market to slip significantly, until support was found at the .618 Fibonacci Retracement priced at 15,310 SATS. This is a Fibonacci Retracement measured from the entire second bullish wave described previously.
The market has since rebounded and is currently trading at resistance marked by the 100-day moving average. If price action can continue above the 100-day moving average, we expect immediate resistance to be located at the short-term .382 Fibonacci Retracement priced at 19,619 SATS.
Alternatively, if the bearish momentum continues to progress, we expect immediate support to be located at the short-term .5 Fibonacci Retracement priced at 17,464 SATS. Support below this level can be located at the .618 Fibonacci Retracement priced at 15,310 SATS.
The RSI indicator has recently managed to battle its way back above the 50 handle, indicating that the bulls are beginning to gather momentum once again. If the RSI can continue to rise, we can expect the bullish run follow suit.
Related: Top 3 Exchange Coins